APIs and Excel Add-In
Your data. Your way. Anywhere you need it. We’re thrilled to announce that ORTEX data is now available via API and our brand-new Excel Add-in.…
It all starts with the Data. Now the Data talks. Ask It.
Join for Free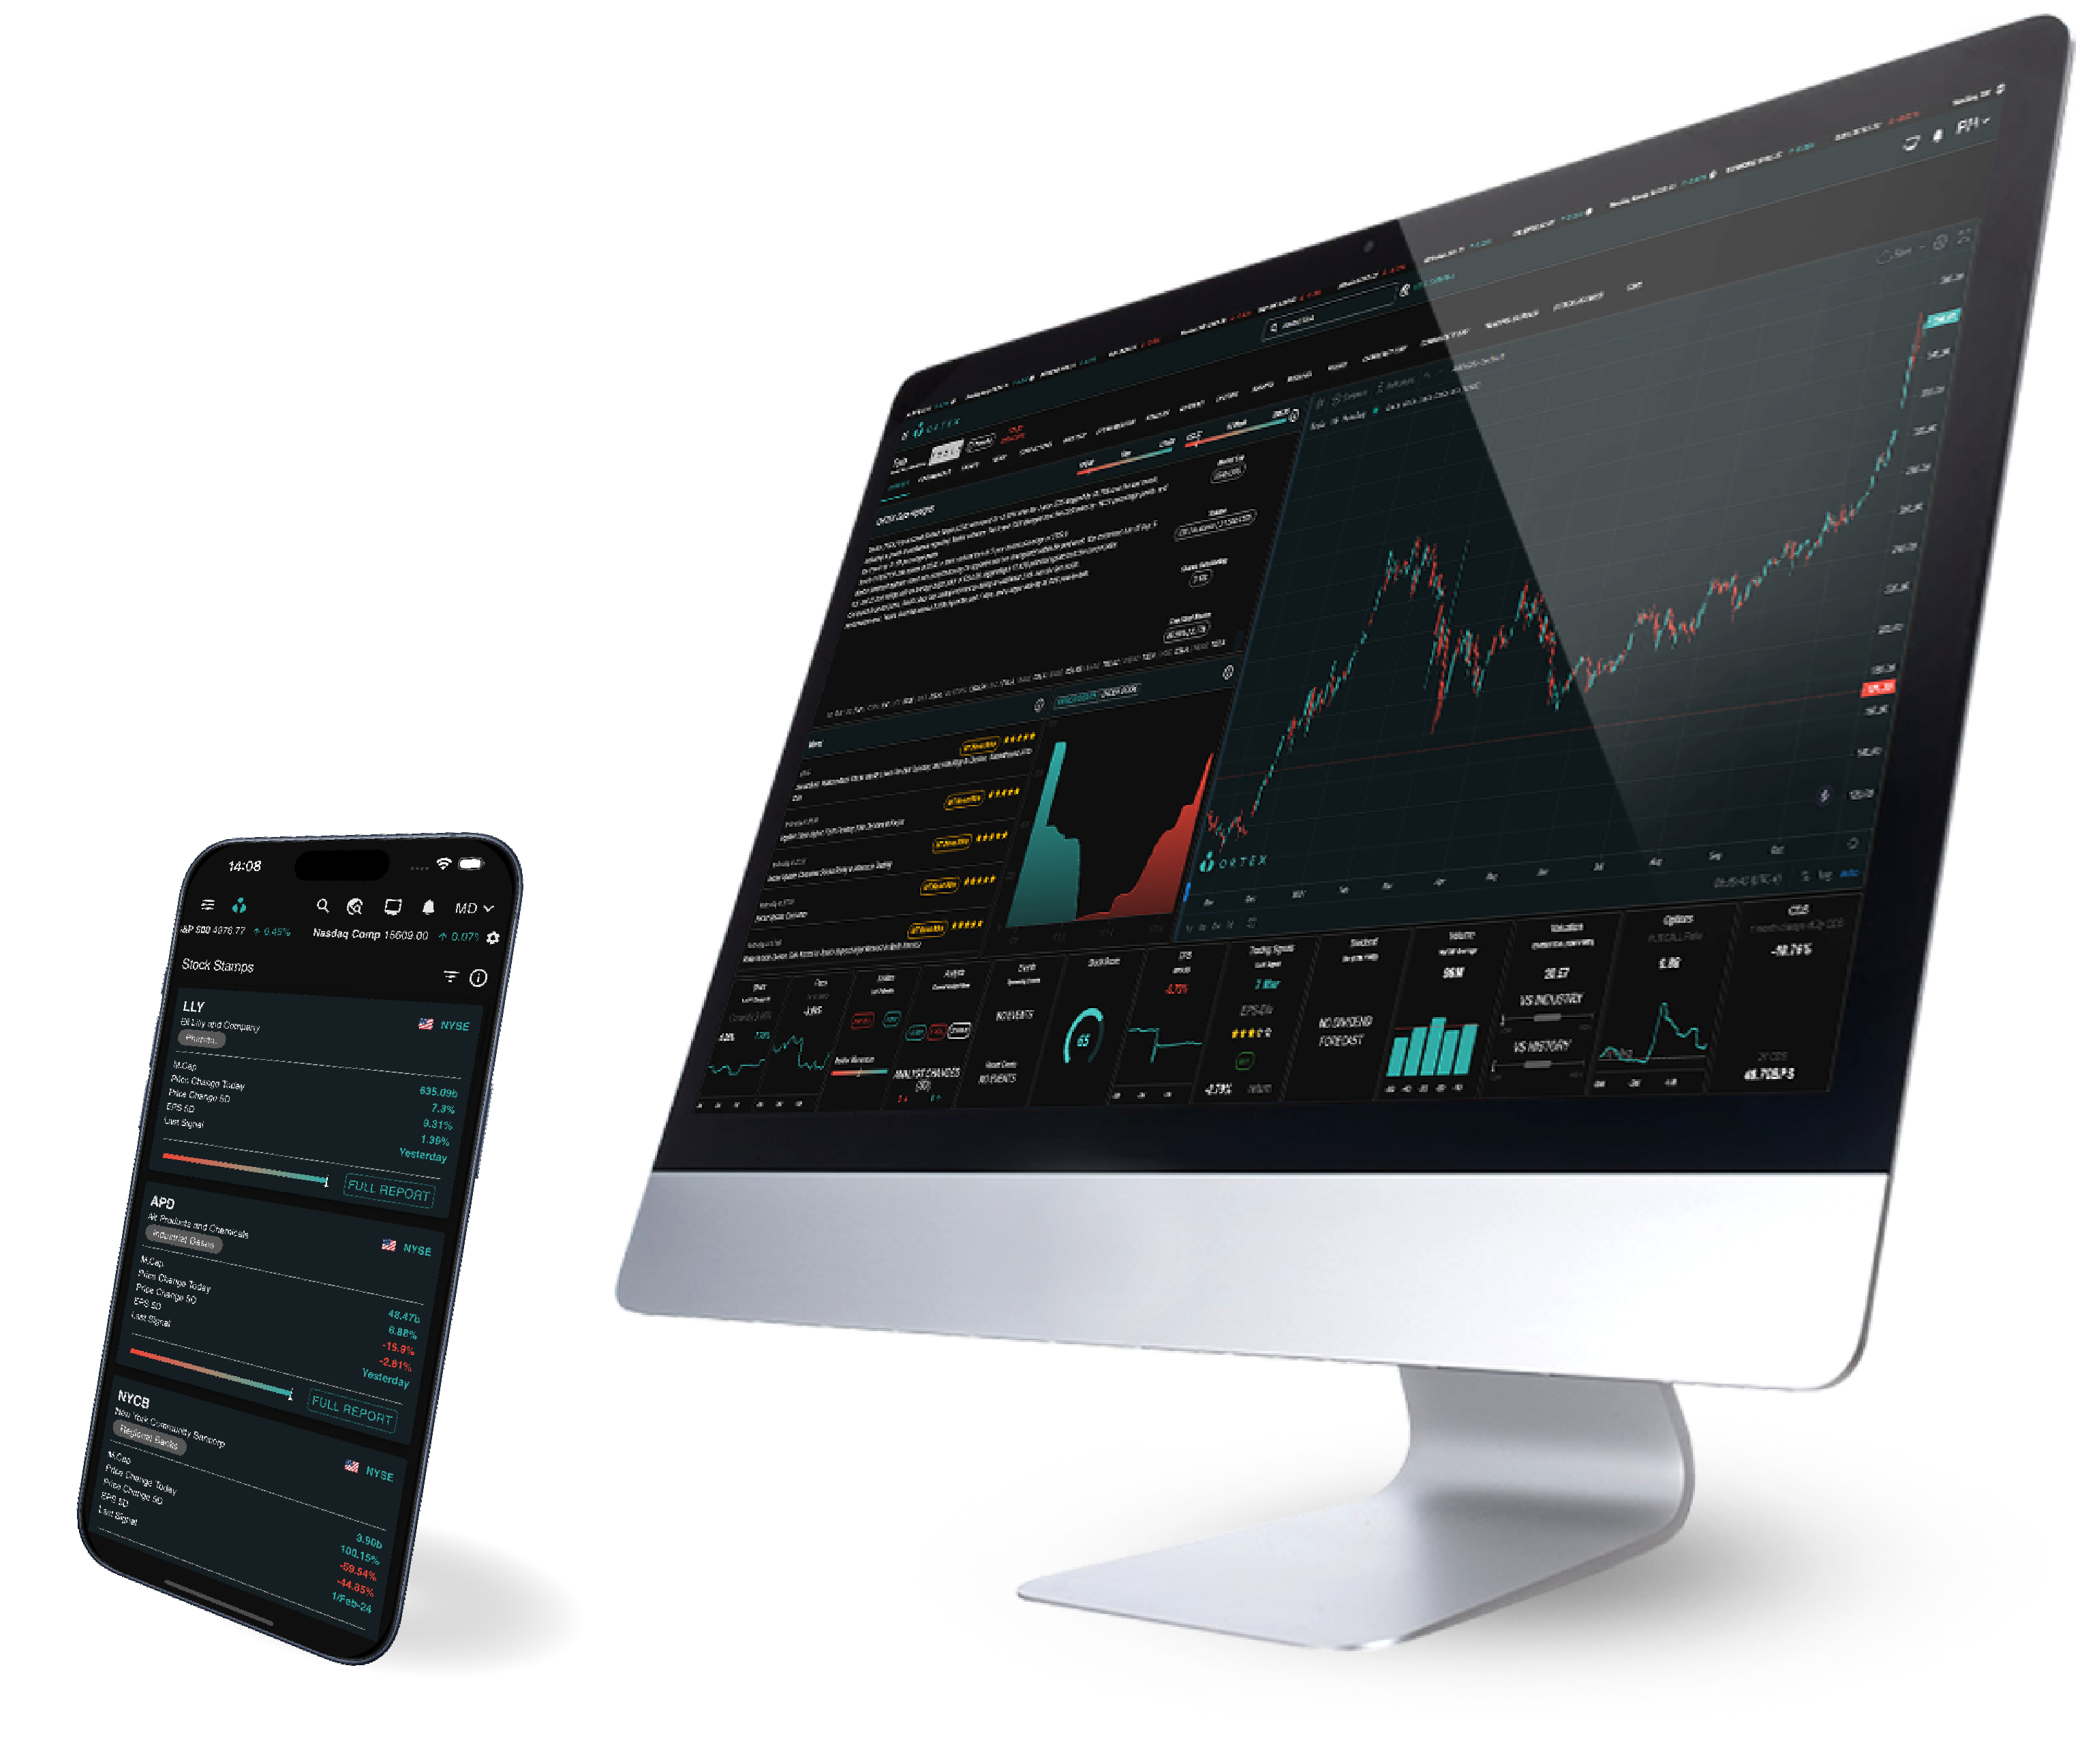

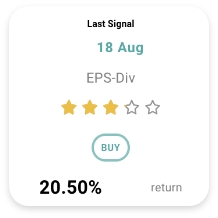


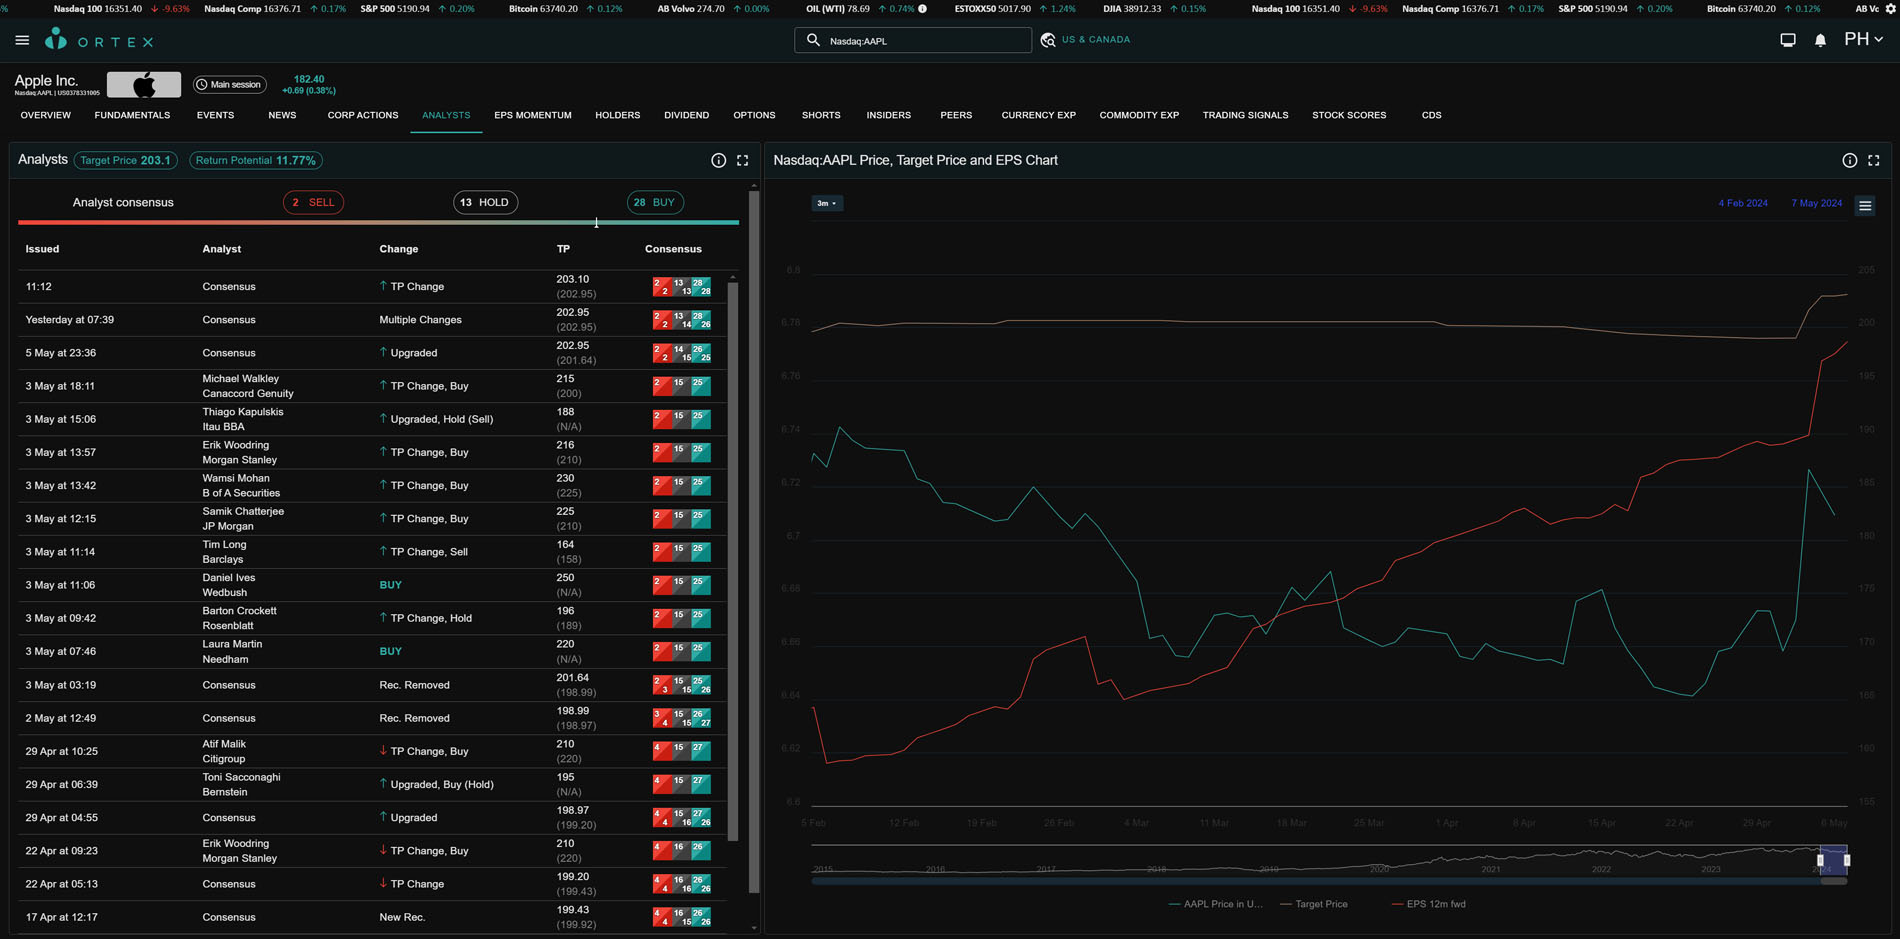
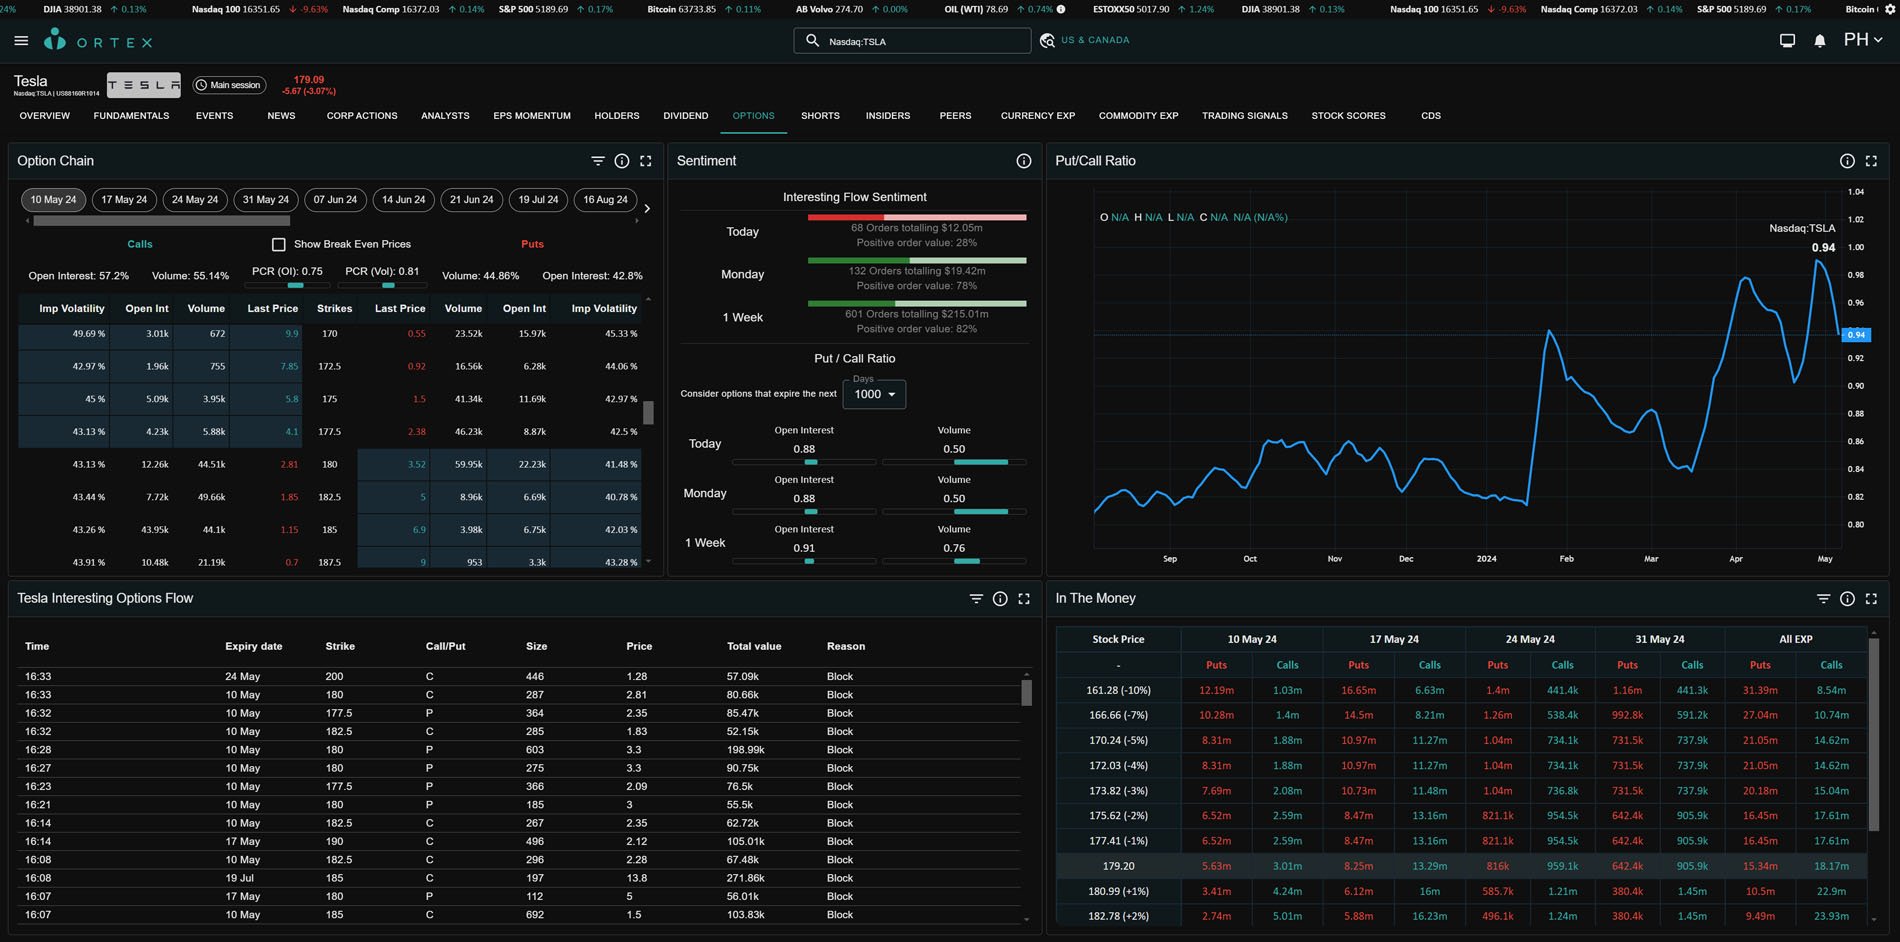

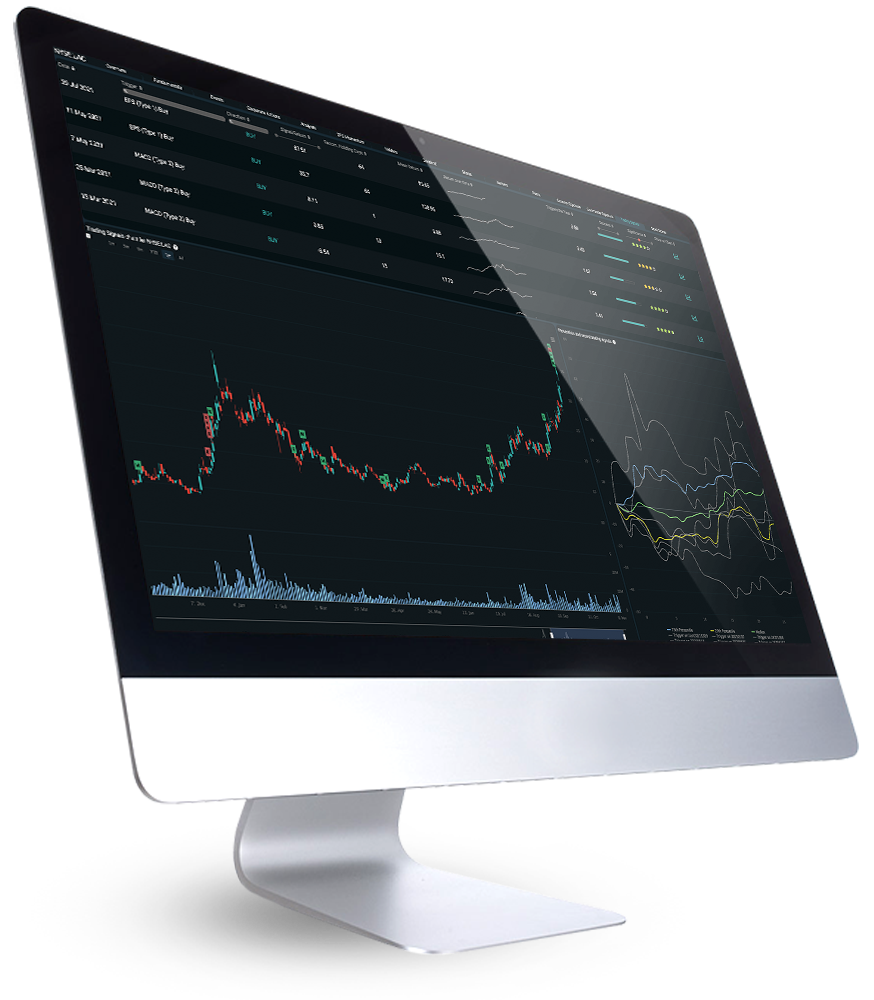
For each signal we tell you how many times the signal has triggered in the past, the success rate and the average return, as well as what holding period has previously given the best return. We also help you visualize this with star ratings, success bars and charts.
Every day ORTEX identifies alpha-generating opportunities. The alpha trading signal will tell you how much return has historically been made as well as the optimal holding period and relative success of this signal in the past.
ORTEX has five families of trading signals: Short Squeeze, EPS, RSI, MACD and Company Events. The different types of signal look at different aspects of the metric that is the main base for that signal. ORTEX intuitively displays the historical relationships (over 10 years) between stock returns and several of the major technical indicators for a stock; RSI levels, Stochastic, Bollinger band, and MACD. You can evaluate current levels on the chart and see where previous triggers have fired our ALPHA signals. ORTEX’ approach to trading signals is rather cautious, markets can be volatile, and history doesn’t always repeat itself. Hence, we have a two-pronged approach to our signals. We start by statistically determining rare events, and on top of this we use a machine learning algorithm to determine the likelihood of success. This can all be seen from the data we display on our Alpha Trading Signals.
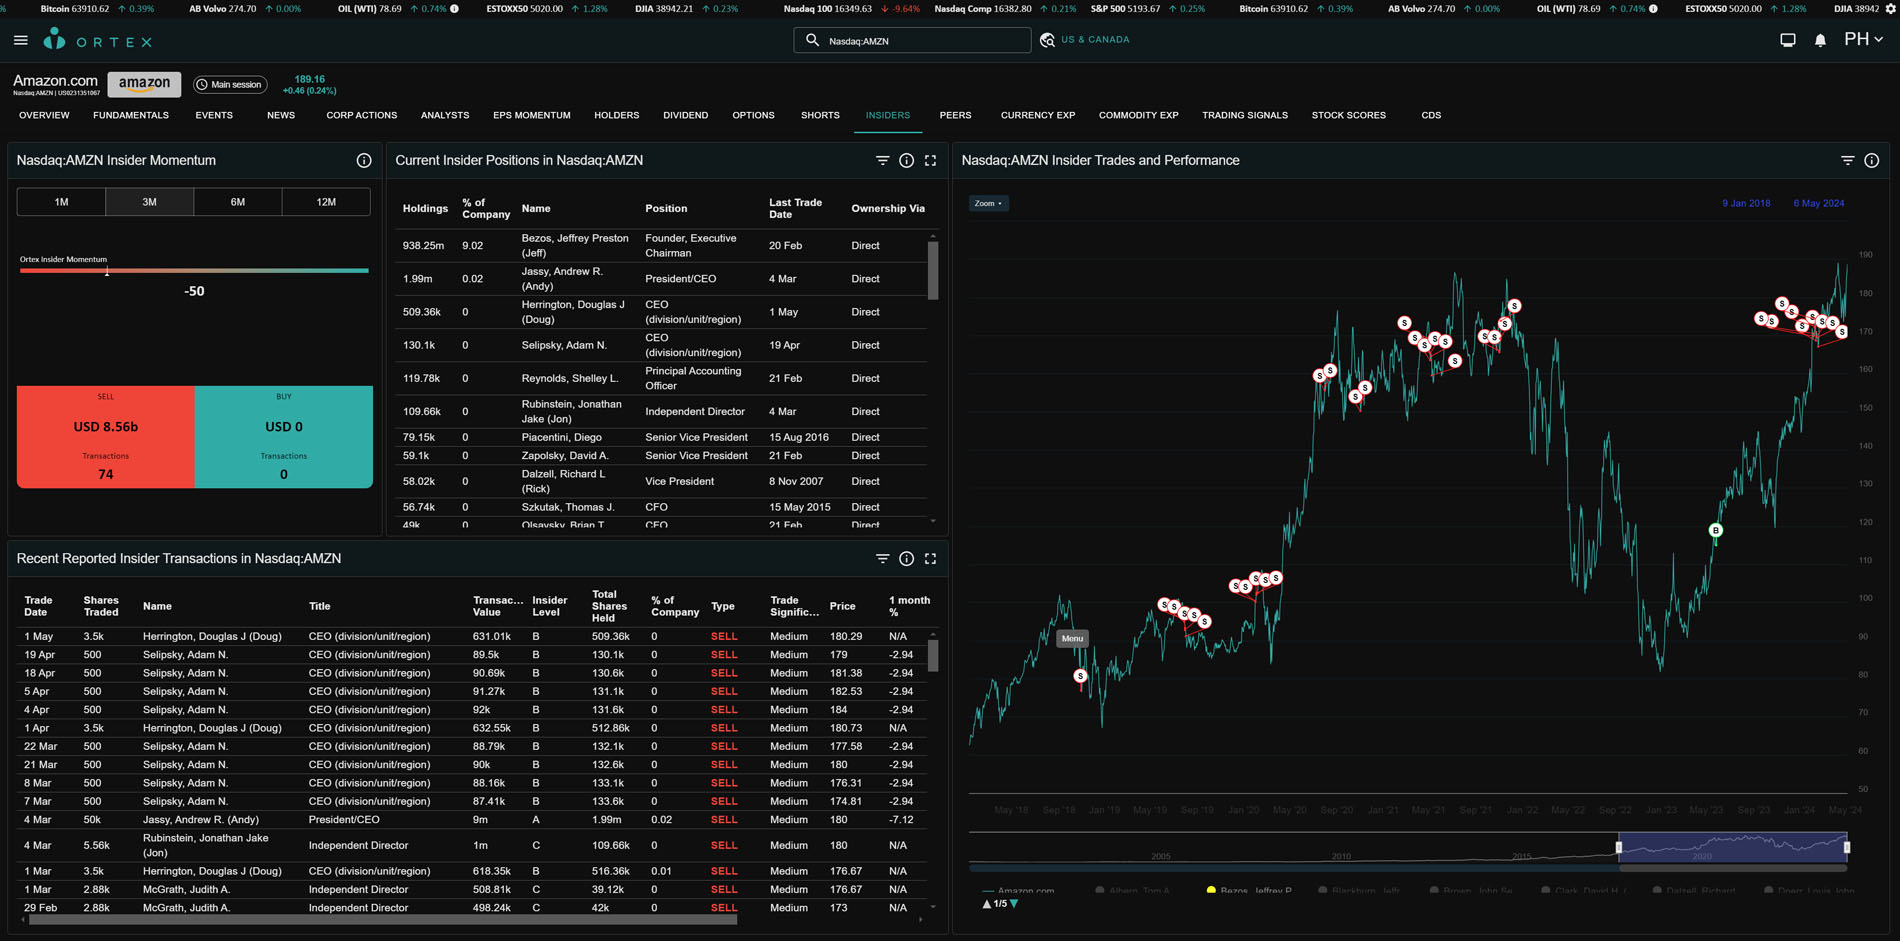
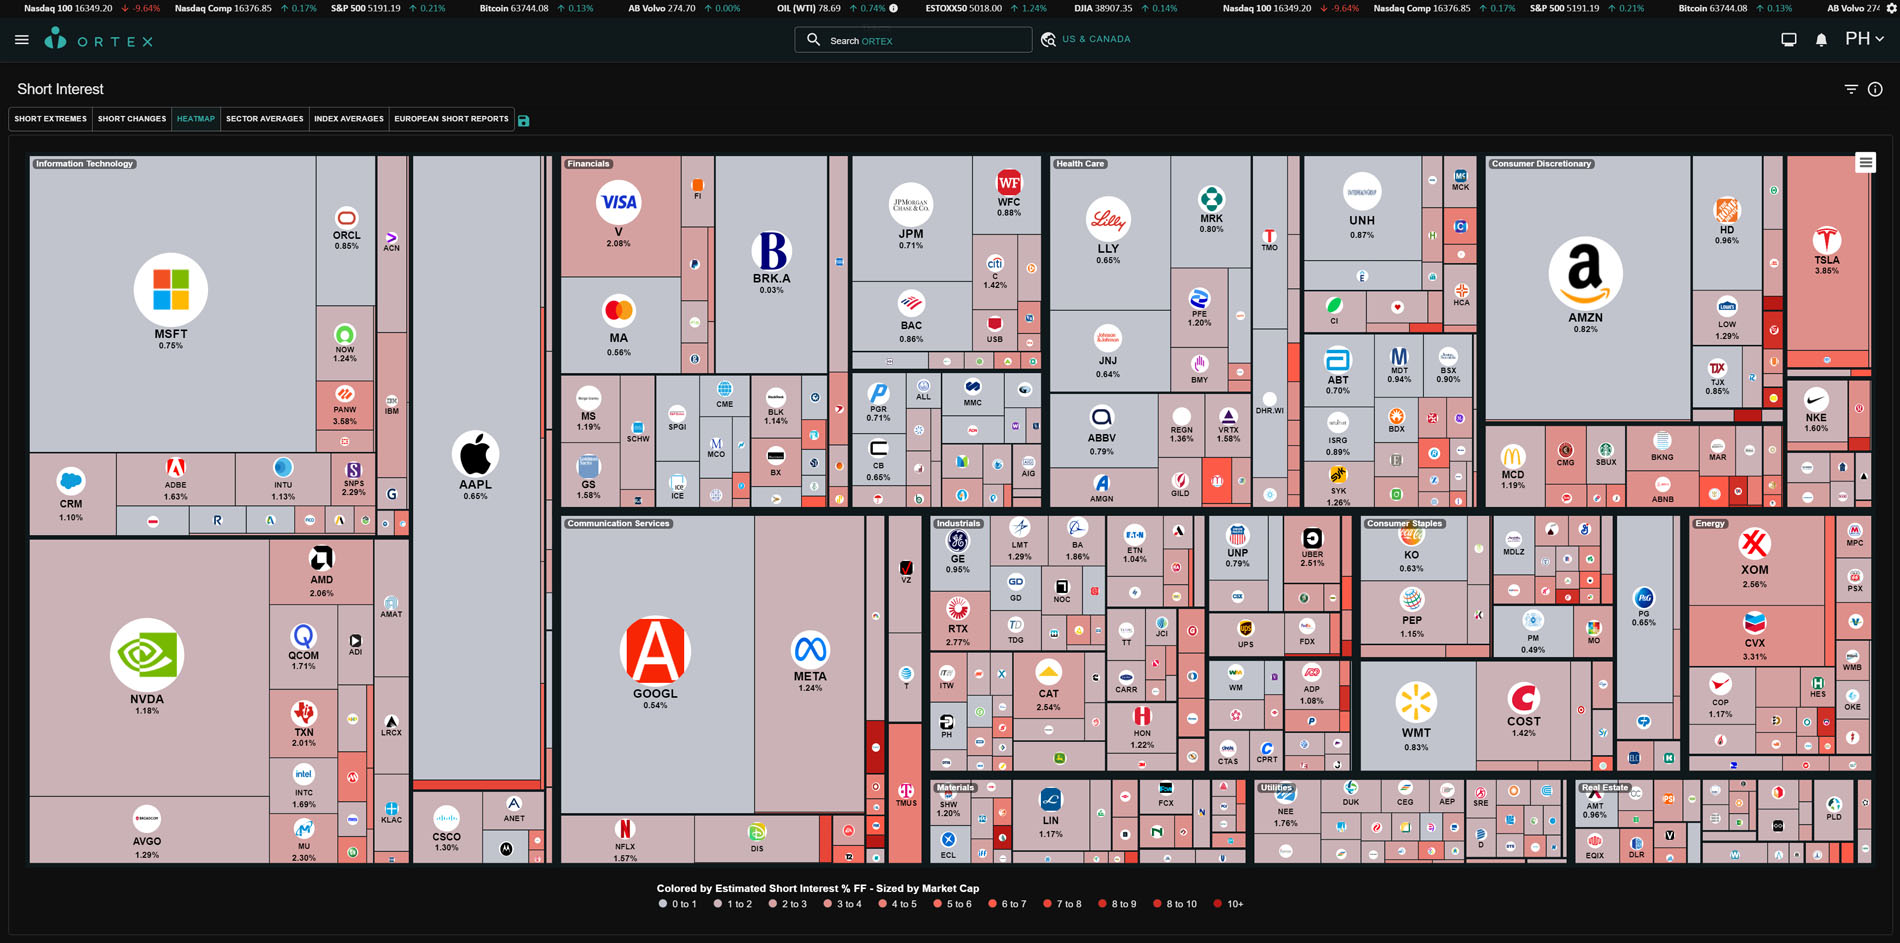
Short Interest data is vital information to have access to – it’s a strong indicator of market sentiment, as it’s an indicator of hedge funds positions, but it can also enable you to understand why there may be sudden and strong buy pressure.
ORTEX securities lending and short interest data provide you with many metrics, such as cost to borrow, utilization, shares sold short, and percentage of shares sold short, all this in real-time.
You can read more about ORTEX Short Interest here
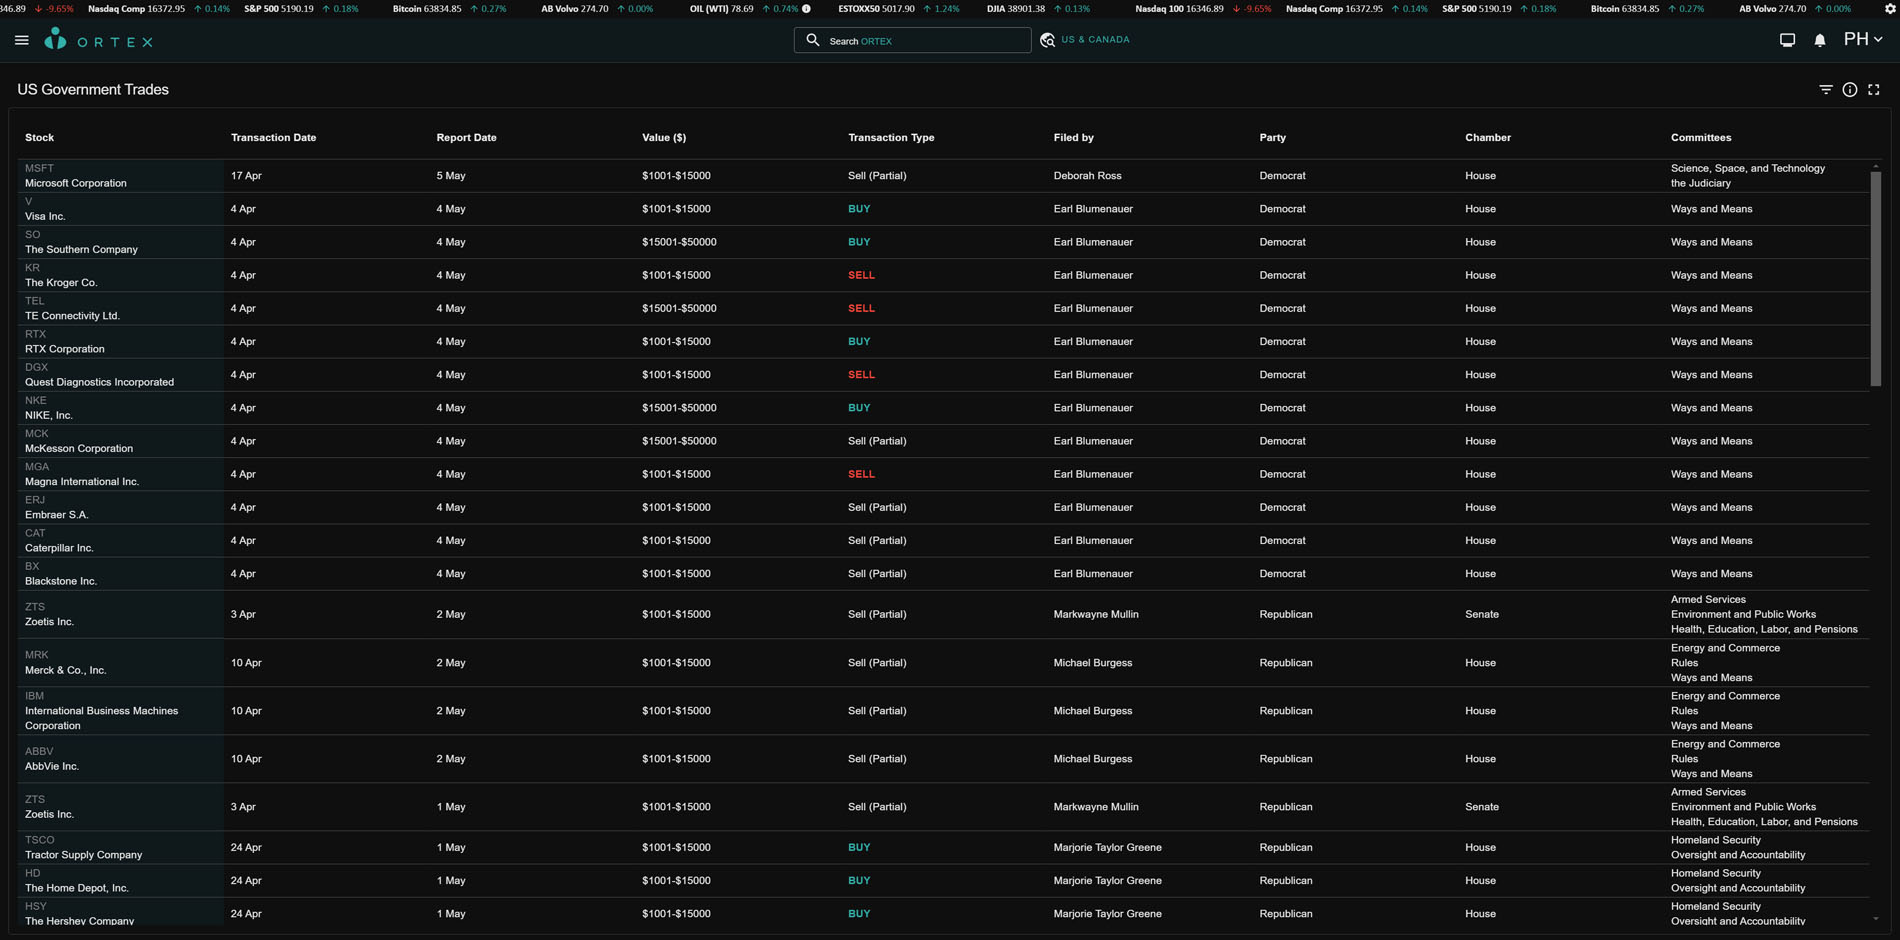
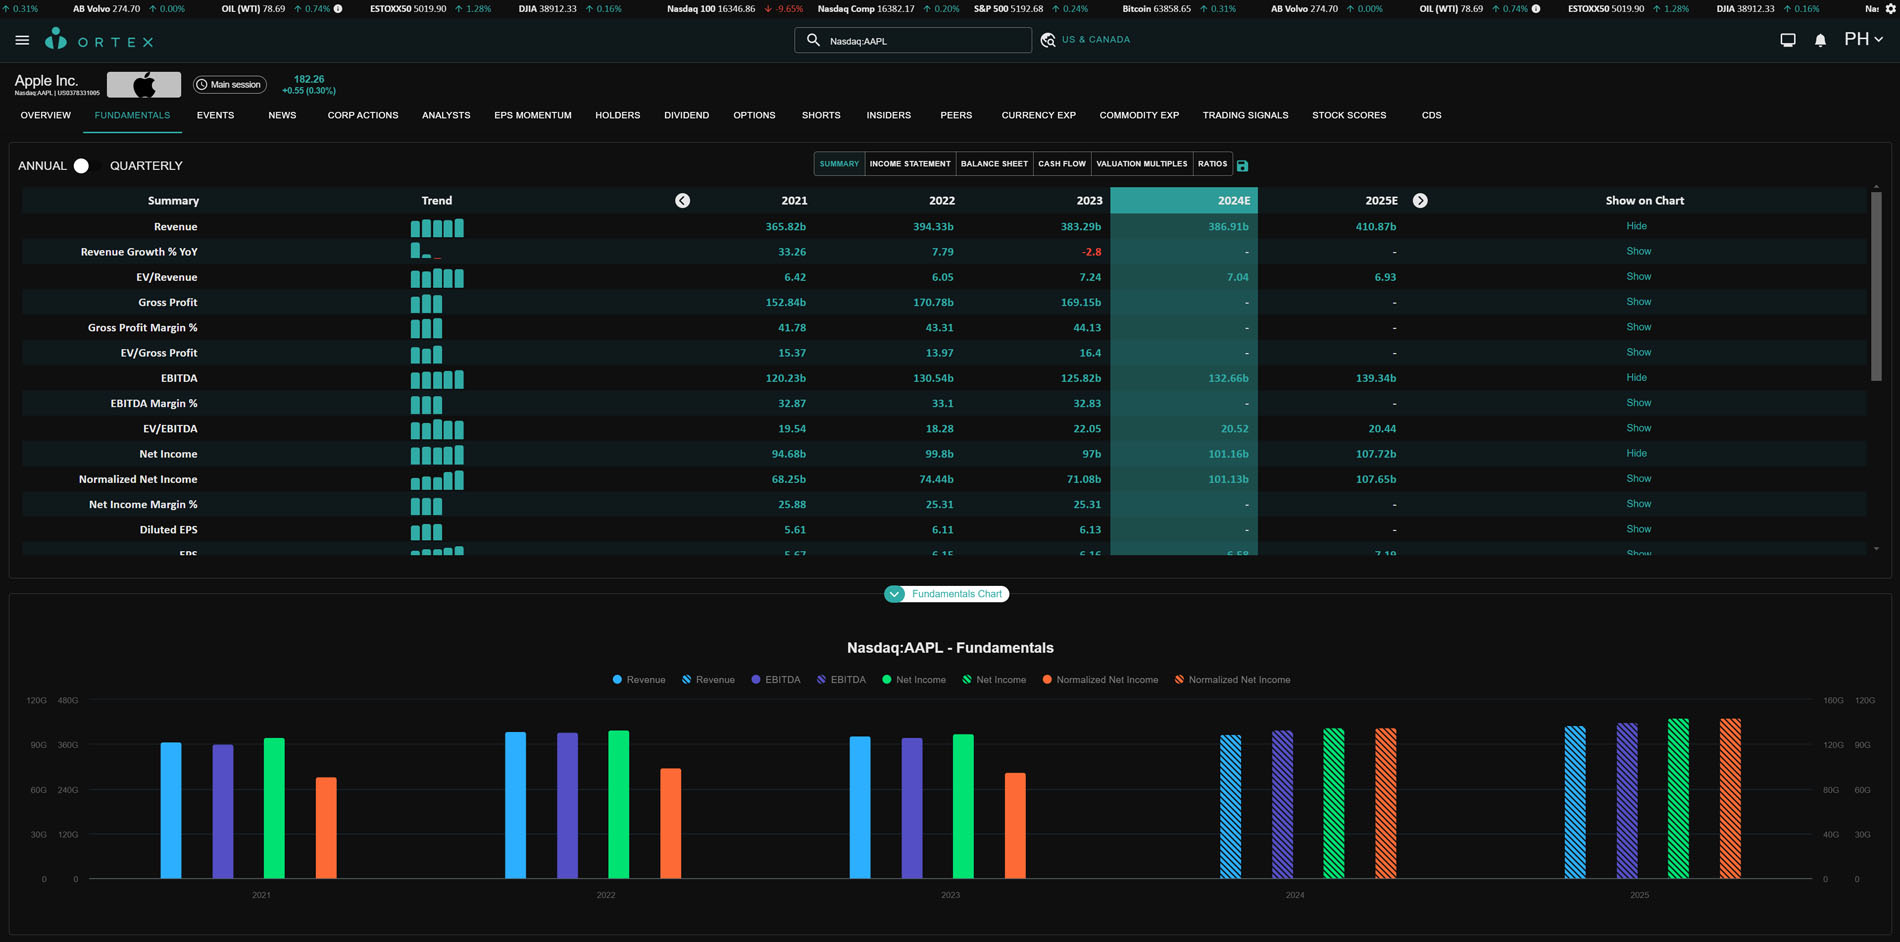
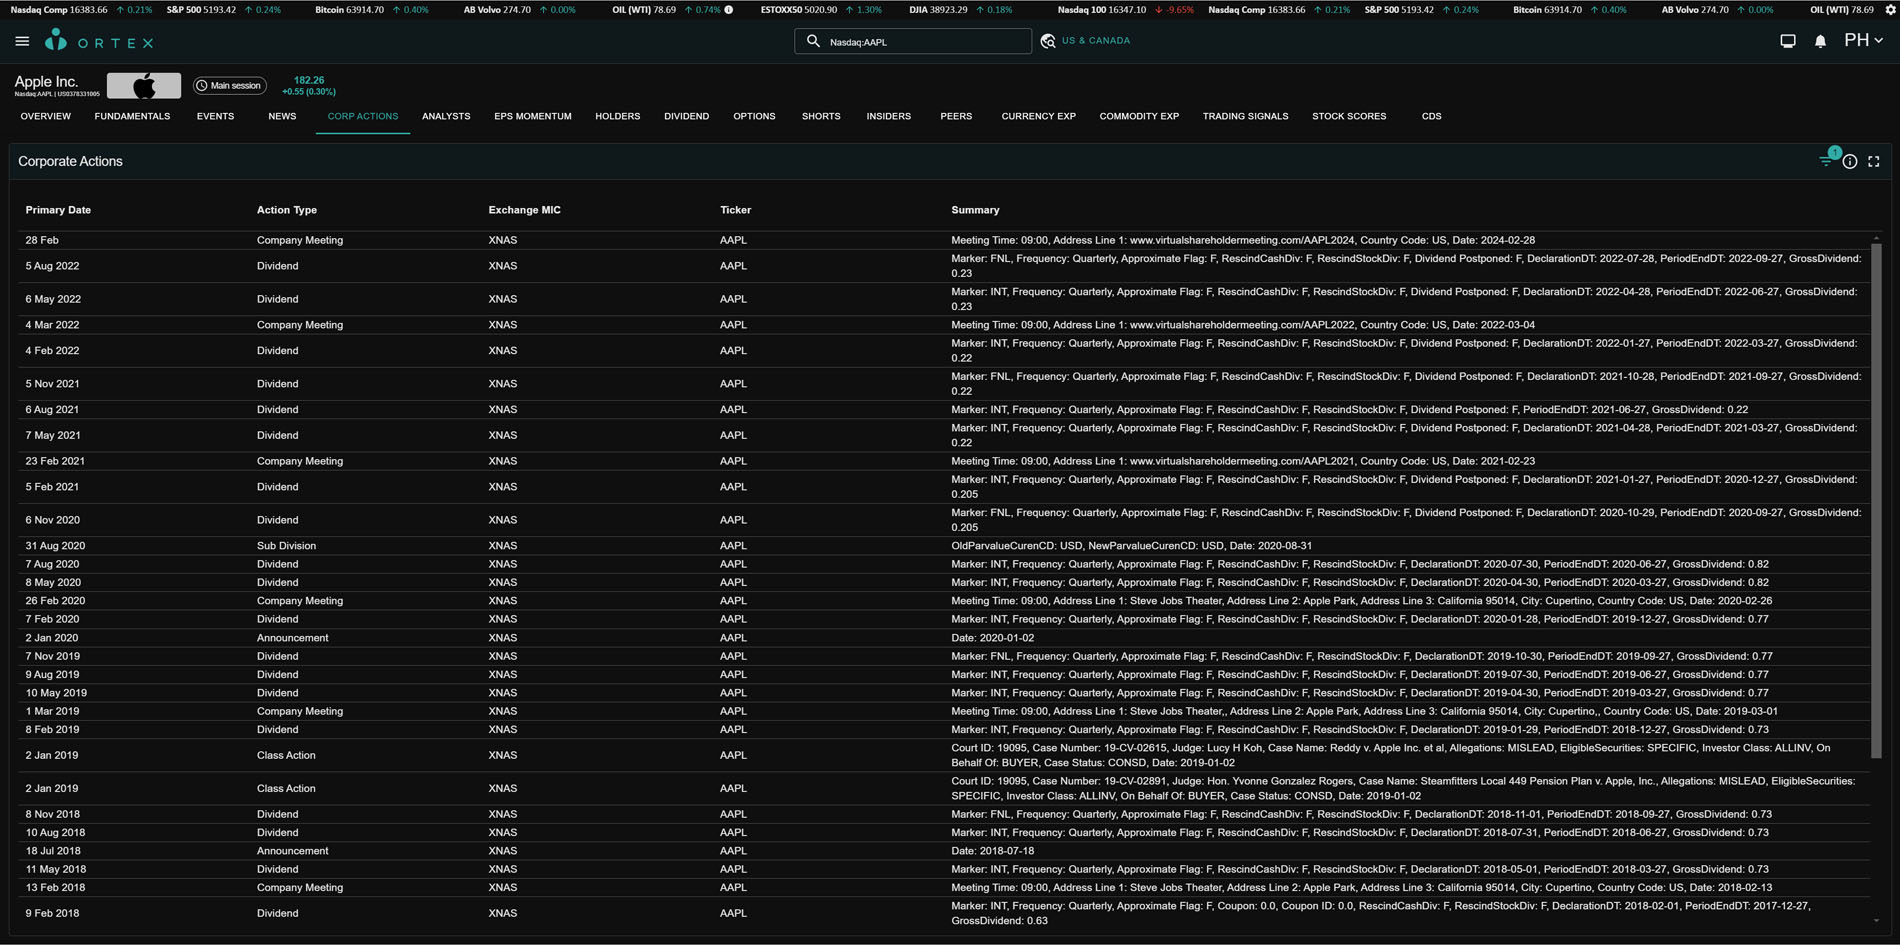
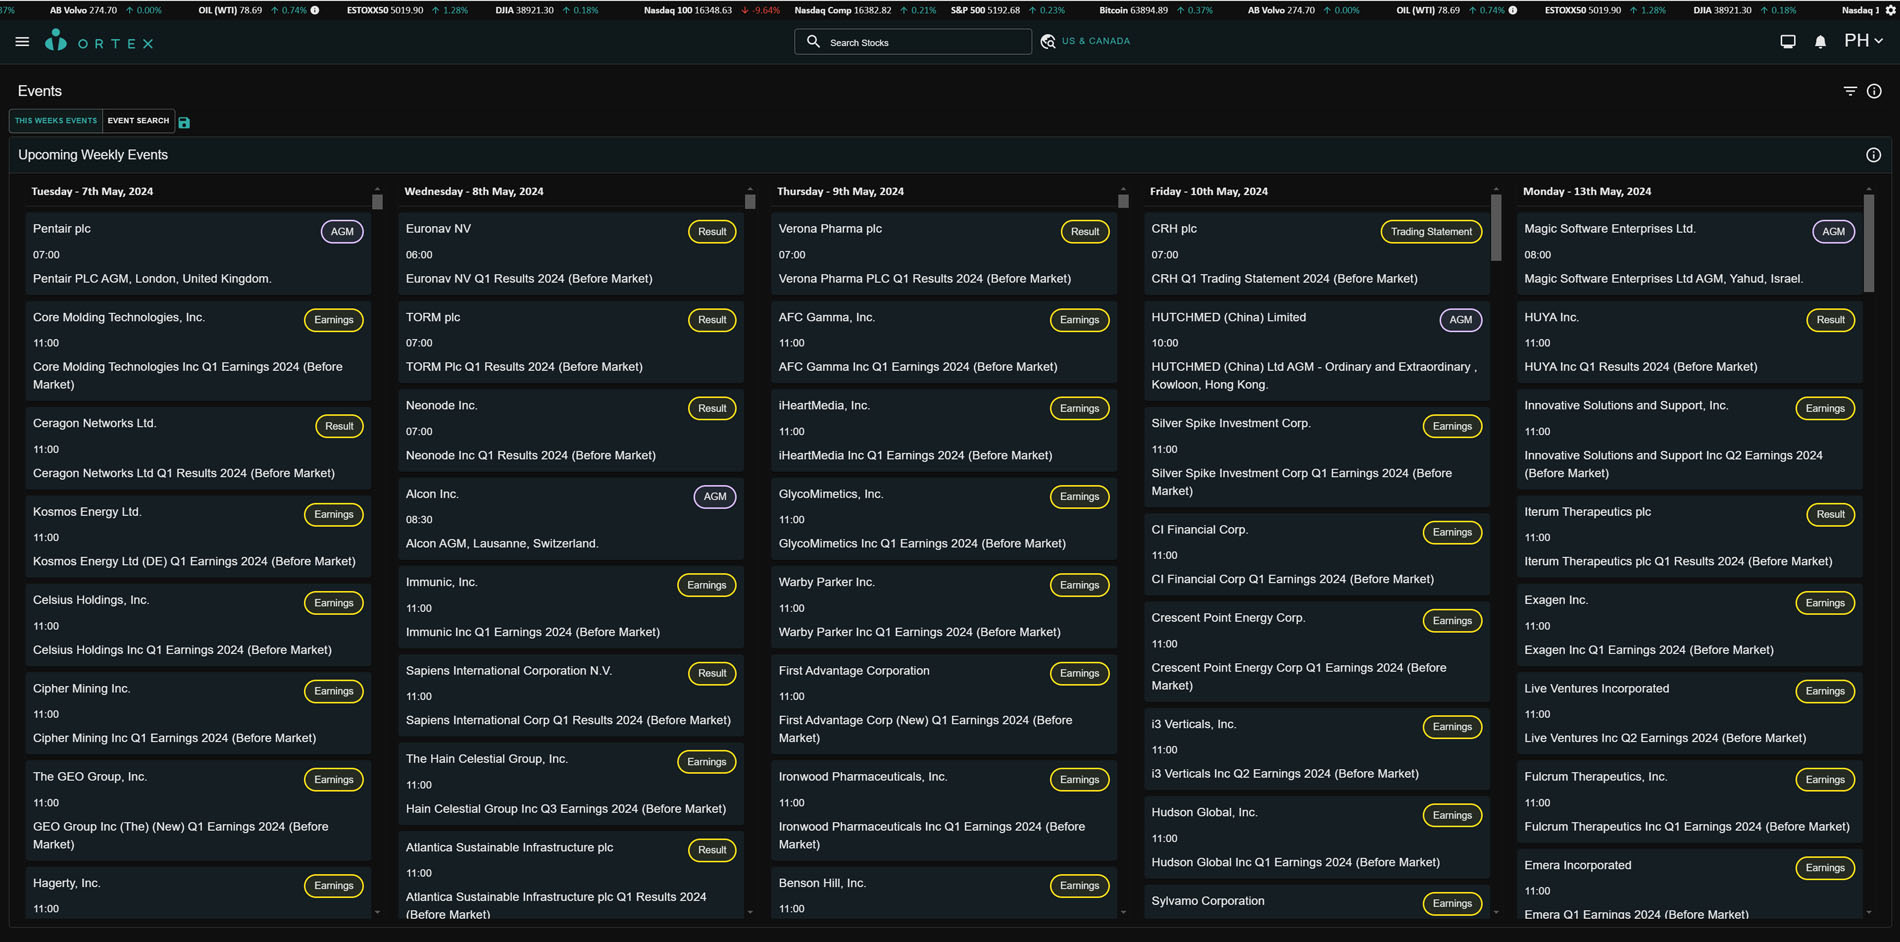
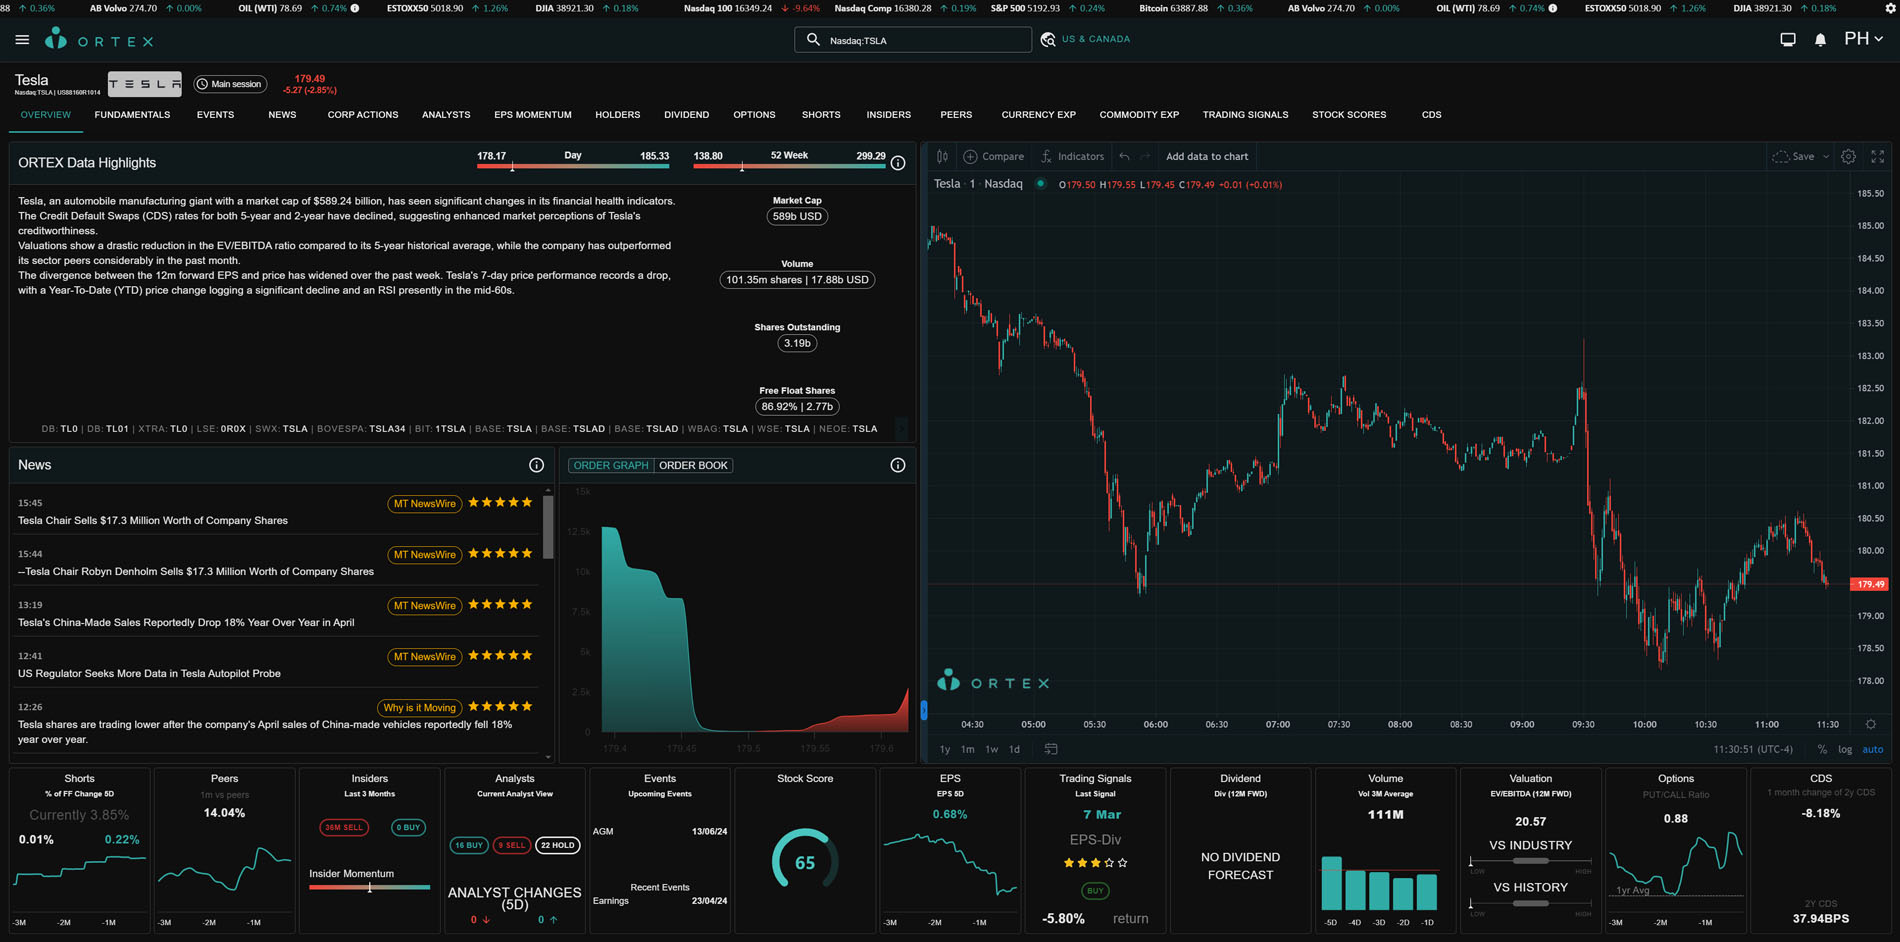
ORTEX APIs, Python SDK and Excel add-in let you integrate the same high-quality data used across the ORTEX platform directly into your own tools, dashboards and automated workflows.
Below is a selection of the datasets you can access:
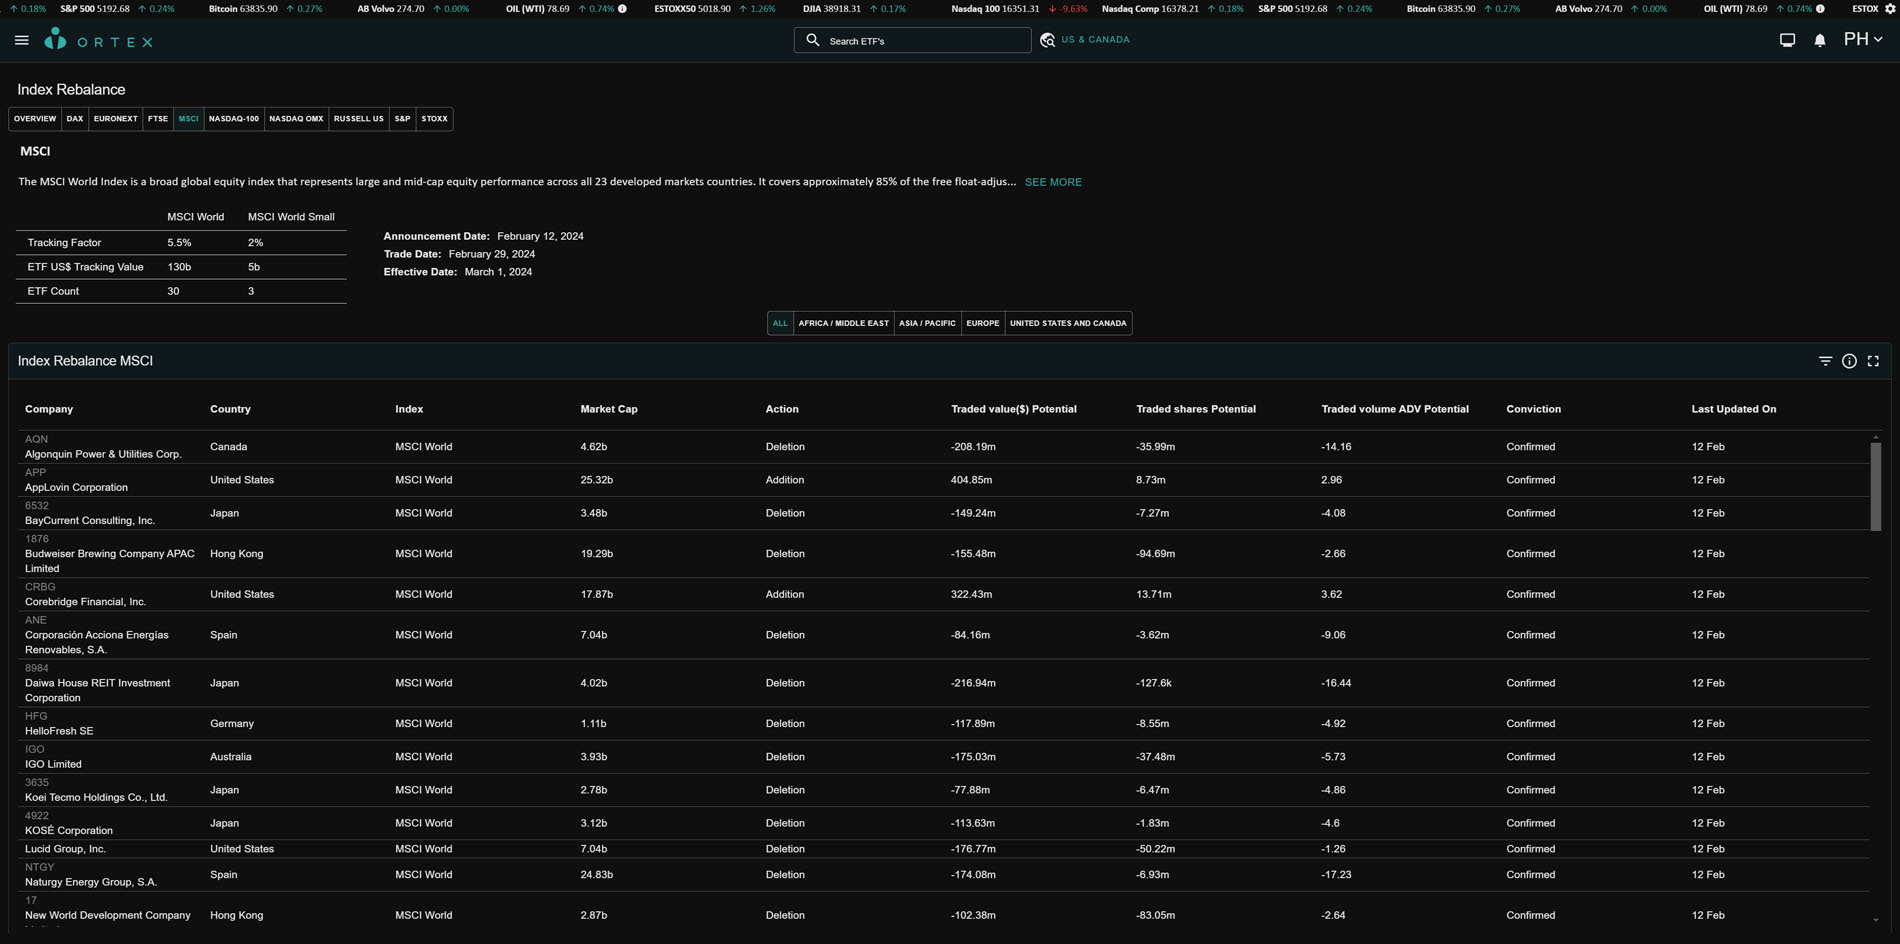
Significant index additions and deletions have important implications for trading dynamics, as index funds are obligated to track the changes. Additions lead to significant buying activity for a stock getting included in an index, while deletions will result in selling pressure. Being able to accurately predict these changes can yield profitable short-term returns for investors and traders. We have developed a model that attempts to predict index changes in advance, based on public information about an index’s methodology and other factors. The dataset will also include an estimate for the total traded value potential, which represents the dollar value of stock that may need to be bought or sold. Predictions can be ranked based on Conviction levels, among other variables.
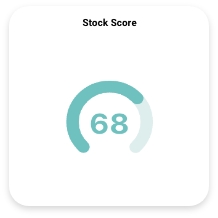
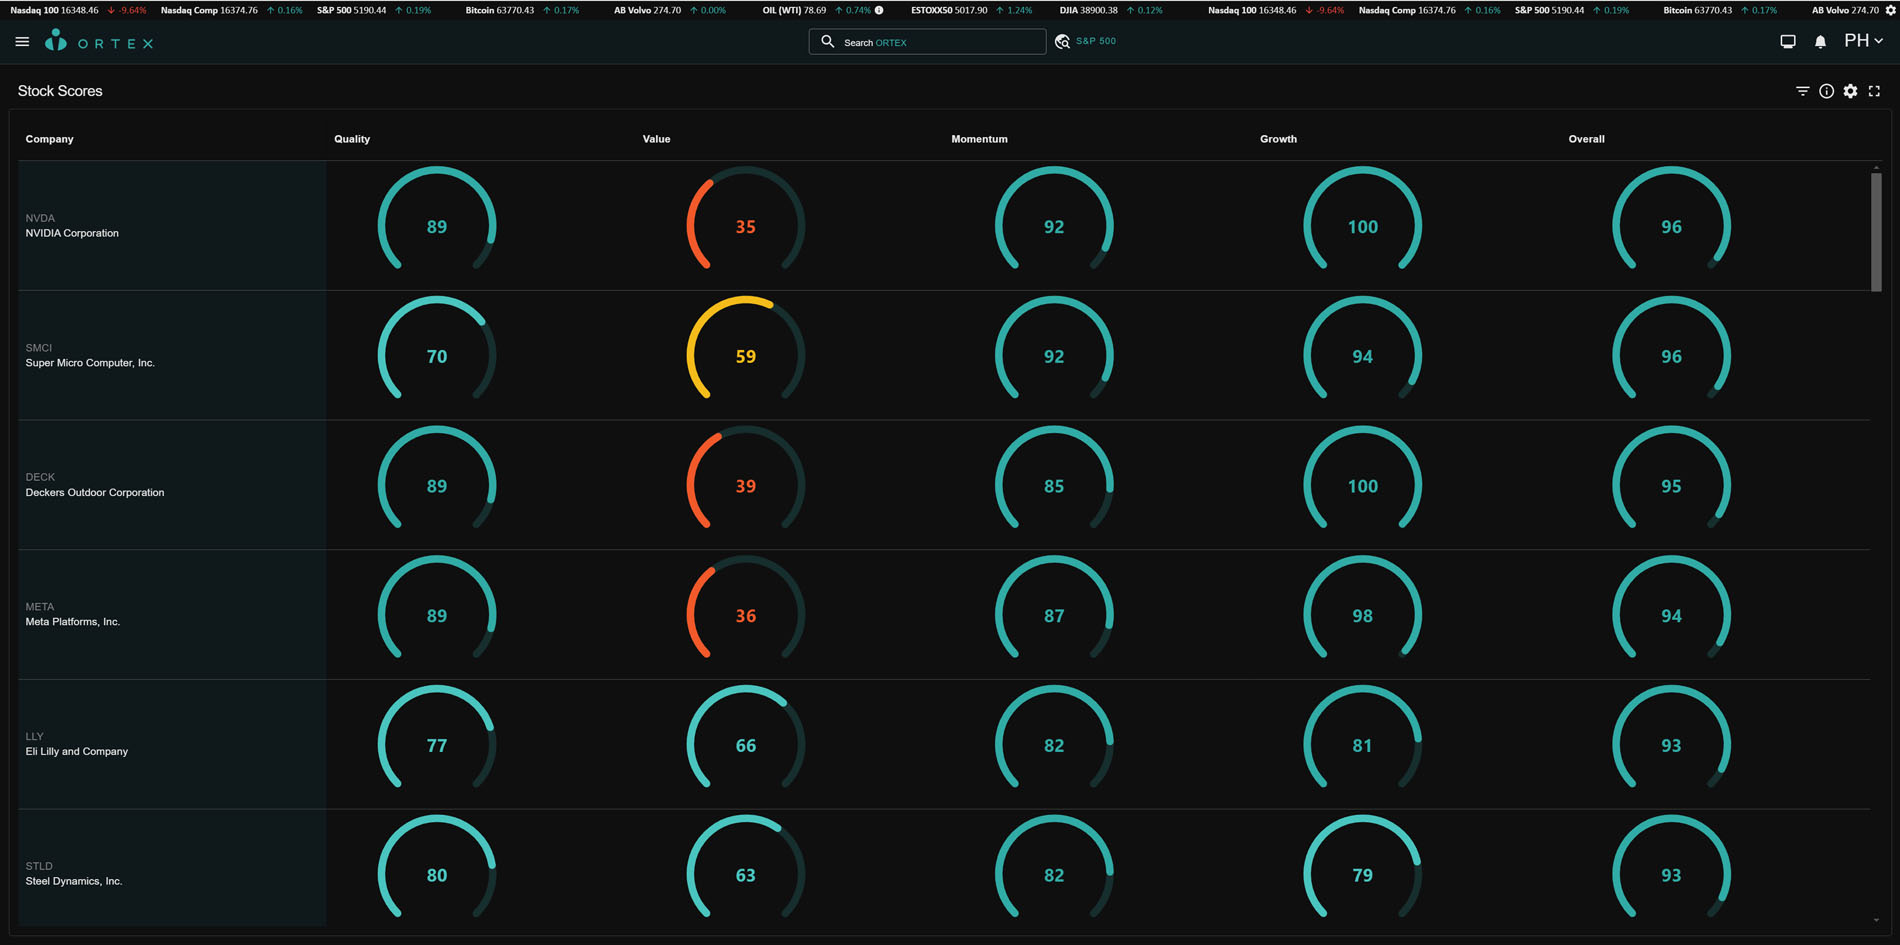
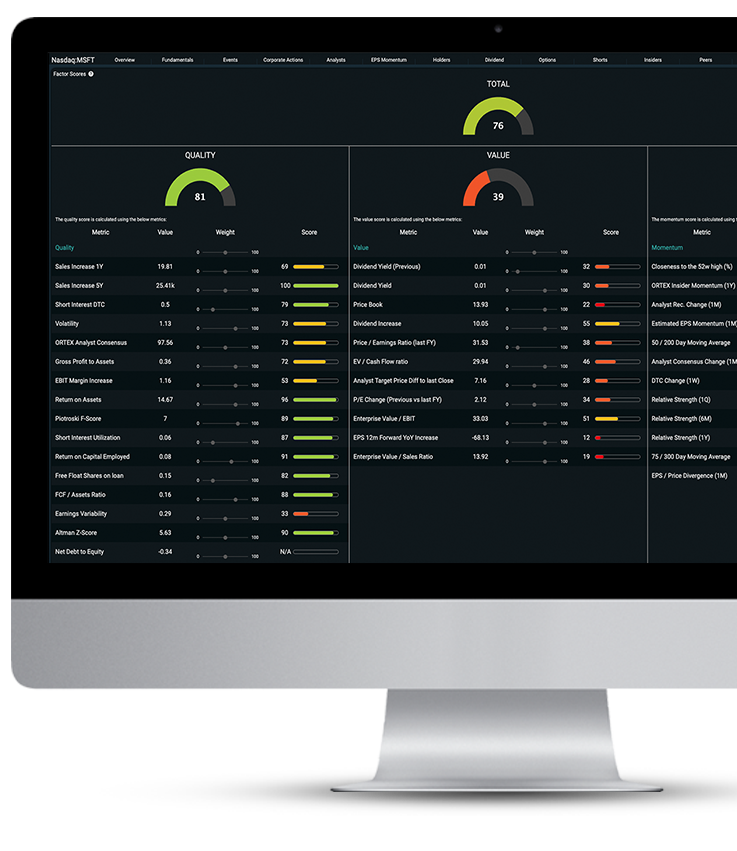
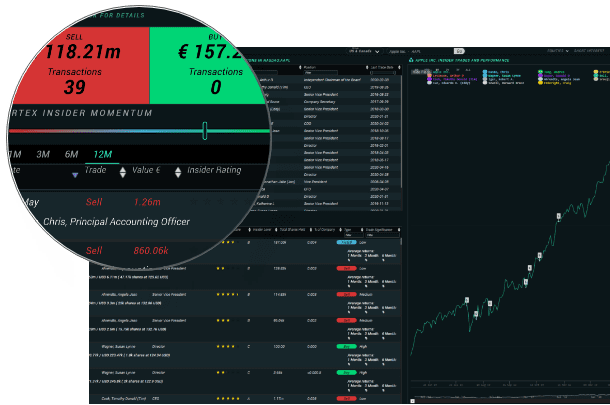
ORTEX Stock Scores are designed to help investors capture the return of factors which have historically shown excess market returns. These attributes which are associated with higher returns are; Quality, Momentum and Value. ORTEX Stock Scores can be further filtered to suit Geography, Sector, Size, Liquidity and Yield. In addition to these more traditional baskets, ORTEX also have a score for Insider activity, Short analysis score and Relative correlation diversion. These scores can be viewed separately as can all individual components of each factor but form part of the relevant Quality, Momentum or Value Factors. All the above combine to give an overall ORTEX Stock Score. Each stock is ranked as a percentile against their market peers from zero (worst) to 100 (best) for each factor before being brought into the equal weighted Stock Score.
Check out how a portfolio of just 25 stocks selected based on ORTEX Stock Scores have performed over the past 15 years on the Stock Scores page – ORTEX Stock Scores
ORTEX portfolio tracks and evaluates your portfolio and can sync to your brokerage account.
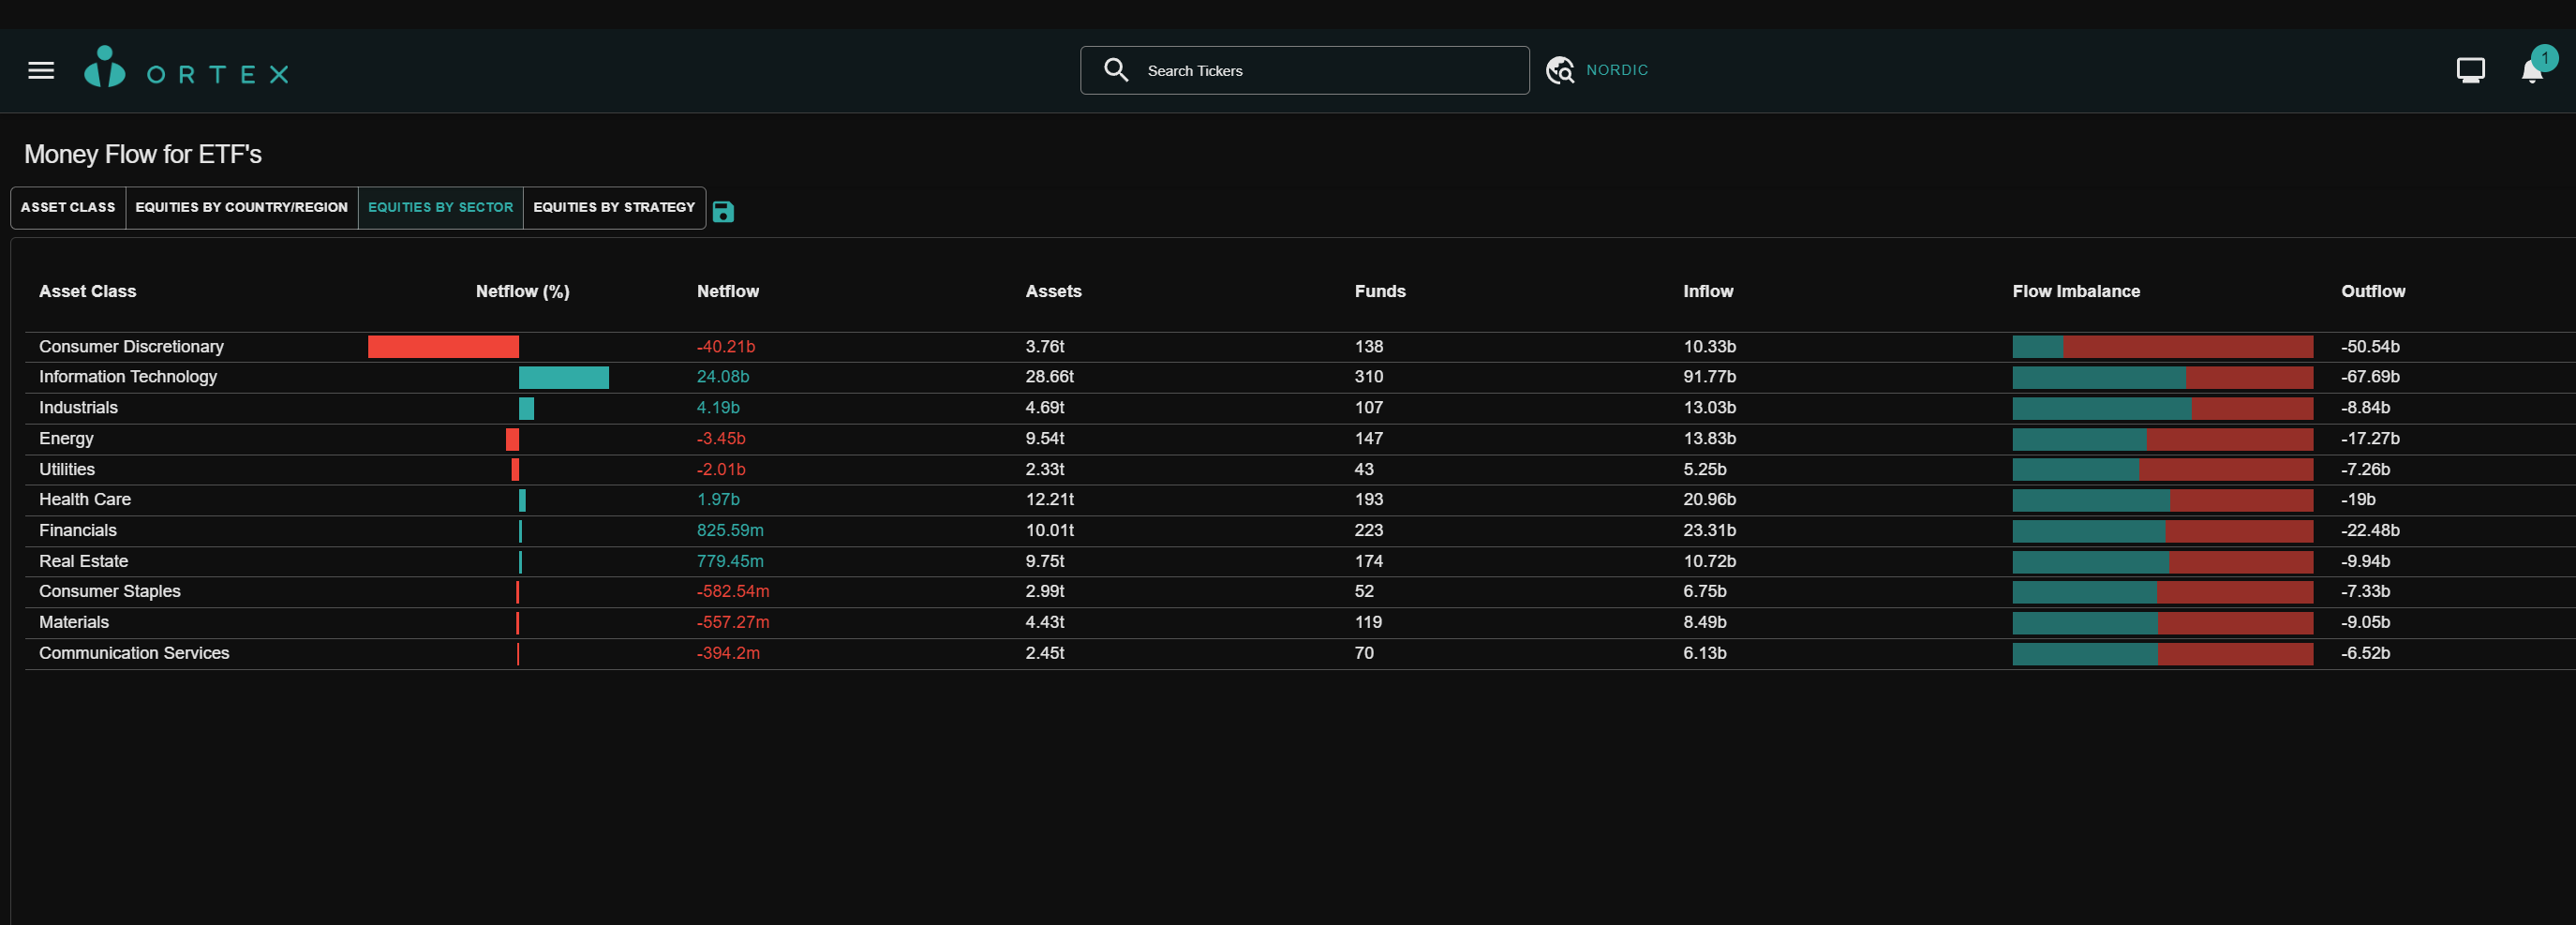
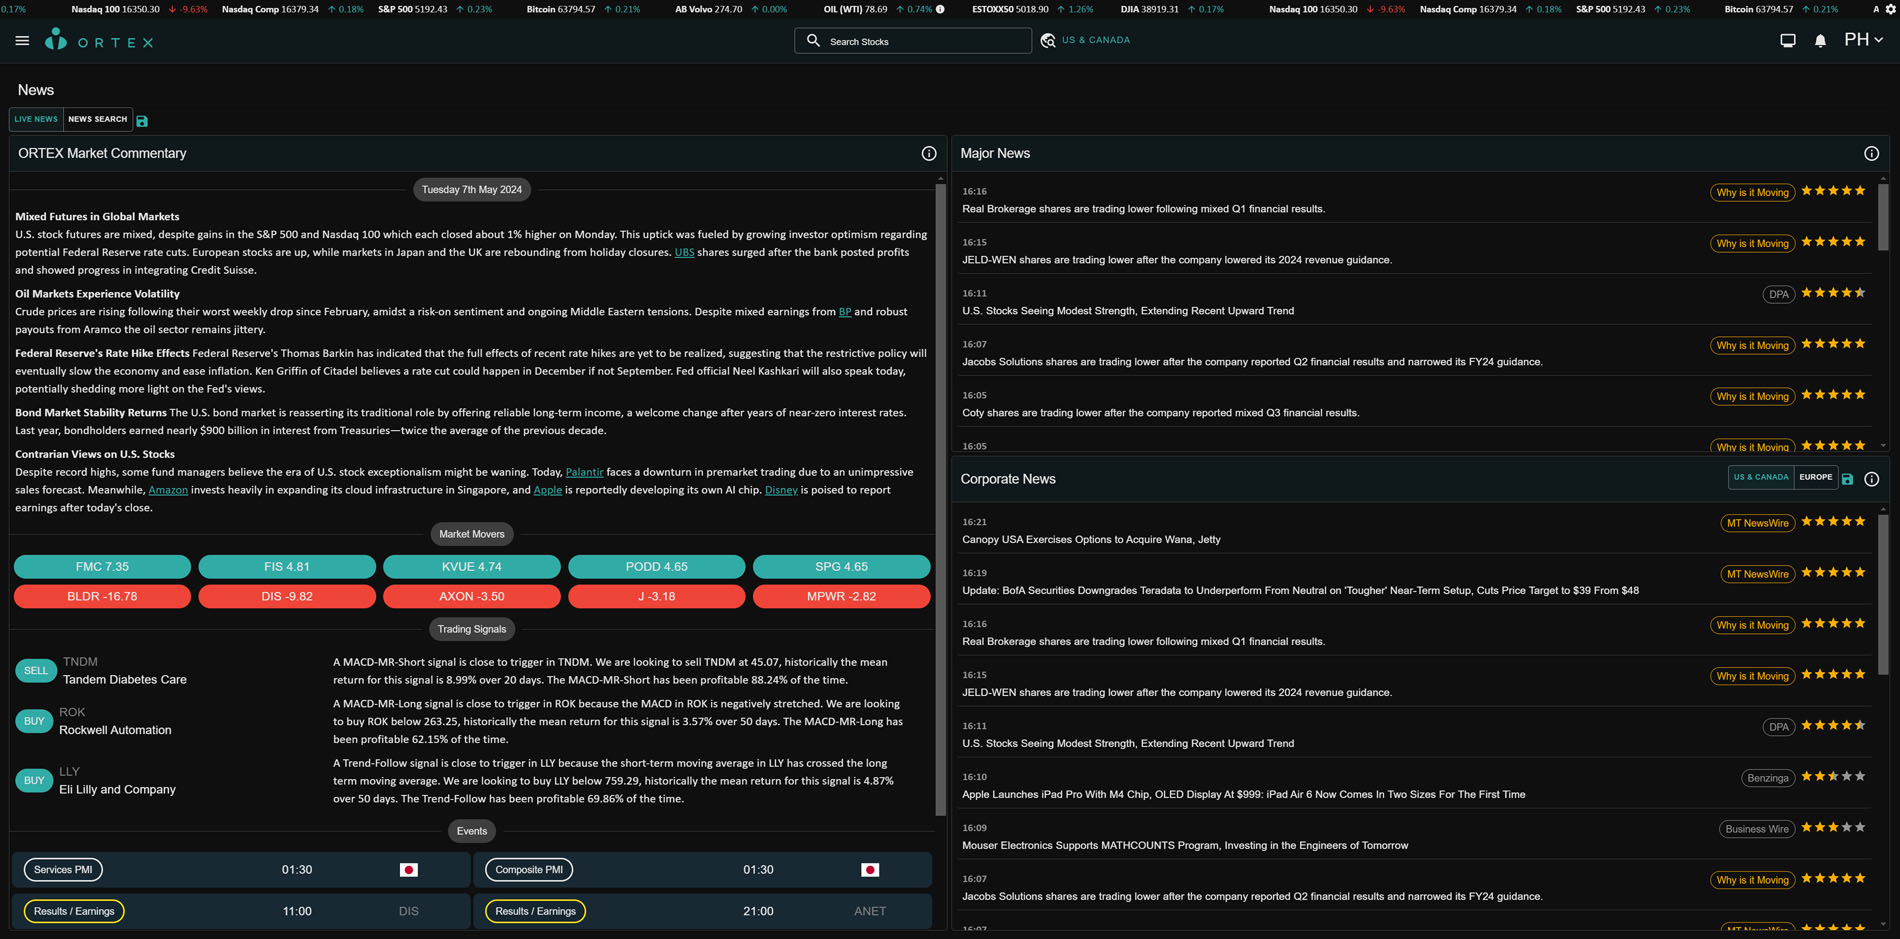
ORTEX brings you live global equity prices, global index prices, live ETF, currency and commodity prices. We also now provide global order book data and live US pre-market pricing. Our flexible charting allows you to access our vast data library.
Our vast data library is available to download.
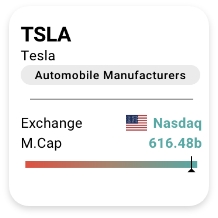
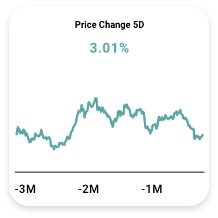
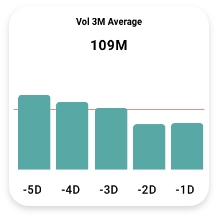
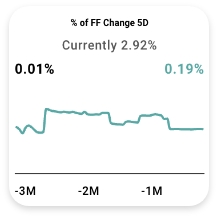
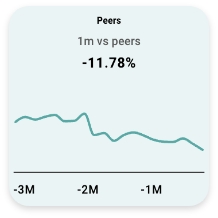
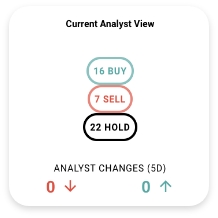
Intuitive boxes that summarise each data set at a glance for your stocks and highlight interesting developments and changes. Saves you hours of searching. ORTEX Stock Stamps are an intuitive overview of many different data sets so users can easily scan and identify anything interesting happening in their stocks. ORTEX Stock Stamps highlight a data box with significant events or changes worth exploring. The stocks with the most highlighted boxes default to the top. This allows you to glance across many data sets such as price, volume, EPS divergence, events, news, shorts, valuation, insiders, analyst changes and more effortlessly without missing anything.

Gain competitive advantage:
ORTEX offers you flexible screening on vast unique data sets to help you find opportunities. Data is now also all downloadable.
Your data. Your way. Anywhere you need it. We’re thrilled to announce that ORTEX data is now available via API and our brand-new Excel Add-in.…
Explore More with Our Upgraded Short Interest Chart We’re excited to announce a major upgrade to our Short Interest charting experience on ORTEX! Designed with…
Palantir, Axon, and MicroStrategy join the index, while Moderna, Illumina, and Super Micro Computer exit According to ORTEX’s latest analysis, the upcoming December 2024 Nasdaq-100…
Discover the Stocks You’ve Been Searching For with ORTEX’s Enhanced Screener We’re excited to unveil an innovative enhancement to the ORTEX platform: our newly upgraded…
ORTEX Perspectives on the S&P 500 for January The stock market kept its winning streak alive as all the major averages closed out January…
ORTEX Perspectives on the S&P 500 for December The stock market finished 2023 with a bang as the S&P 500 climbed for nine weeks…
In the fast-paced world of finance, staying ahead of market trends is crucial for investors. One tool that has gained prominence in recent years…
ORTEX Perspectives on the S&P 500 for November In what is a historically strong month for stocks, all three major averages snapped their three-month…
We are currently looking for Data Engineers – Full Job Description
We are currently looking for DevOps Engineers – Full job description
We are currently looking for Customer Services representatives – Full job description
We are currently looking for Front-End developers – Full job description
We are currently looking for Python developers – Full job description
We are currently looking for Quantitative Analysts – Full job description