ORTEX Stock Score
By ORTEX Research
ORTEX Research · Backtest Brief
$1,000 → $24,596 in 16.3 years.
What score-driven stock selection has shown historically.
Two long-only S&P 500 strategies, picked by ORTEX stock-score ranking each month, outperformed the S&P 500 Total Return Index by 1.9× and 2.9× in a 16.3-year historical, point-in-time simulation.
Since 2010, two model portfolios that we run on the ORTEX Backtester — using nothing
but our daily composite stock score to pick top-ranked S&P 500 names — have turned every
$1,000 of starting capital into $16,358 and $24,596 in
historical simulation. Over the same 16+ years, $1,000 in the S&P 500 Total Return Index
grew to $8,642.
Want this data for your own model?
The same composite stock scores that drive these strategies are available
to ORTEX subscribers via our API.
Pull current and historical scores at docs.ortex.com,
build your own factor blend, and run your own backtest. Beat our weights and you’ve
built a better strategy than the one in this brief.
The chart that tells the story
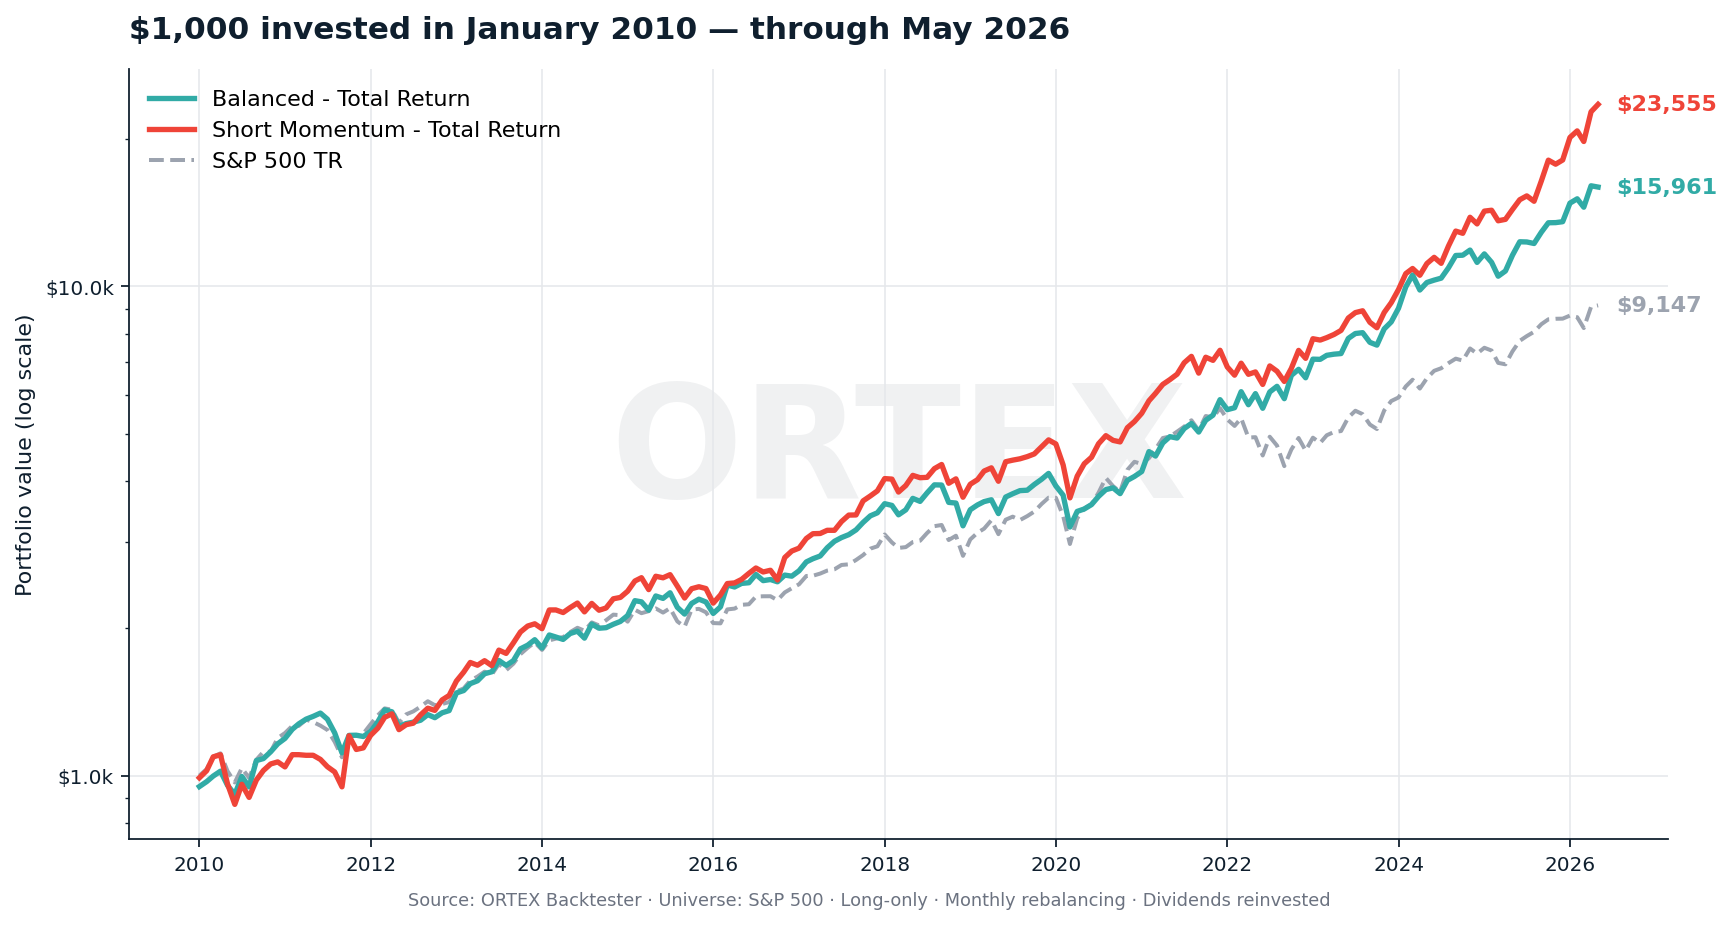
$1,000 invested in January 2010 in each strategy, against the S&P 500 Total Return Index (log scale, dividends reinvested).
Short Momentum has compounded at 21.7% a year over the 16.3-year test
window, vs 14.1% for the S&P 500 Total Return Index.
What’s actually inside an ORTEX stock score
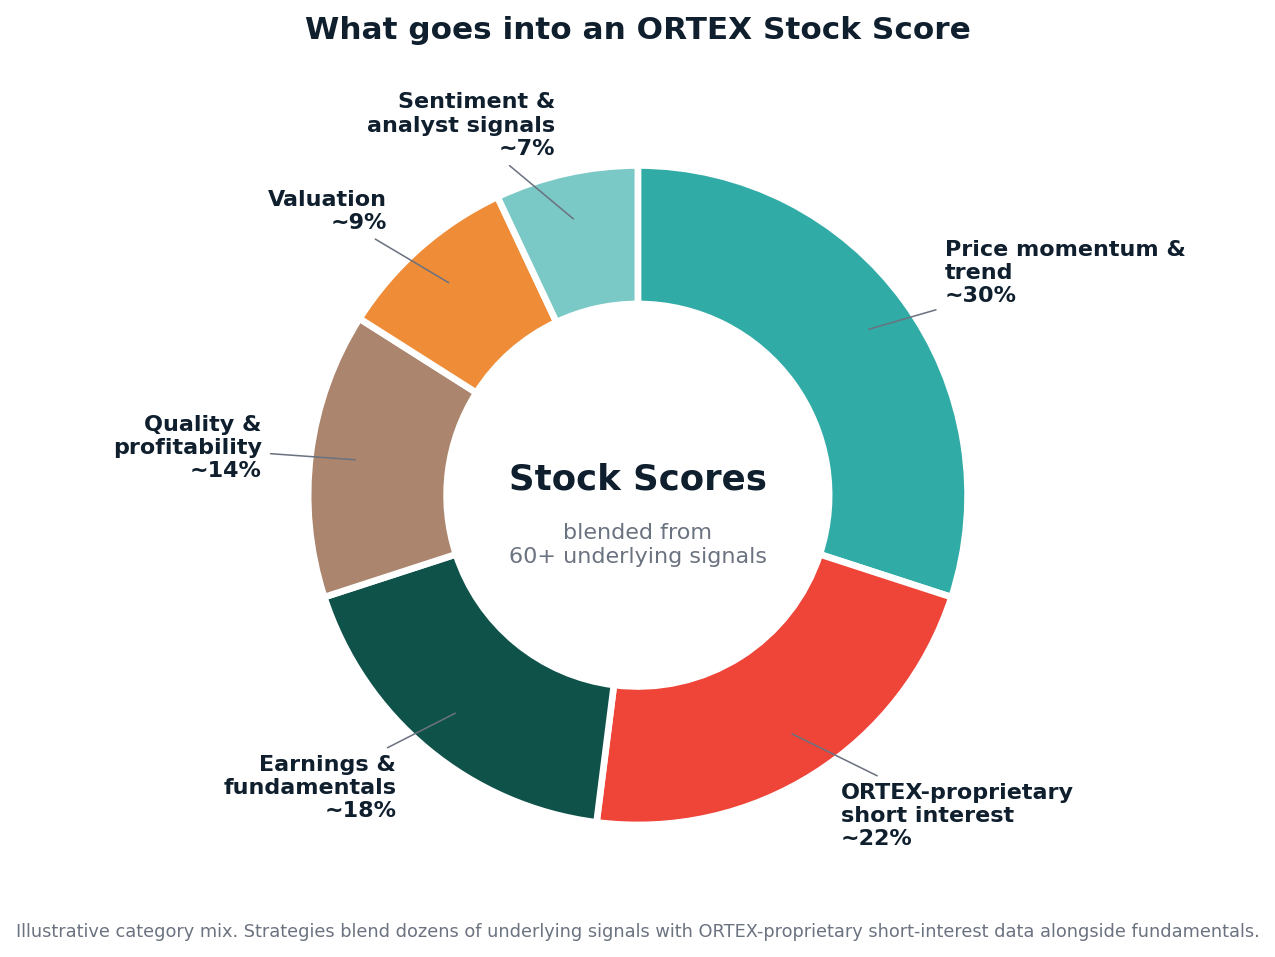
A composite of ~60 underlying signals across six categories. Specific weights and formulas are proprietary.
Every name in our universe is scored daily by blending dozens of fundamental, technical,
sentiment and ORTEX-proprietary short-interest signals into a single composite ranking.
That number answers one question: how does this stock look right now,
versus everything else, on every dimension that matters?
The score draws from six broad categories totalling ~60 underlying signals. A handful
are familiar from any quant playbook — price momentum, earnings growth,
valuation. The rest is what makes the ORTEX score different. Most of the signal
mass comes from data layers that are only available inside ORTEX:
- Proprietary short-interest data updated daily — composite short score, days-to-cover, short availability, free-float on loan, change rates. The most-watched short-interest dataset in the market, derived from real flows rather than estimated from public filings.
- ORTEX-derived quality, momentum and value ML signals — learned cross-sectional rankings that complement the rule-based factors.
- Daily-updated analyst and sentiment signals — analyst recommendation changes, target-price revisions, consensus shifts, dividend signals — pulled and normalized across the full S&P 500 universe in one place.
- Quality and profitability factors derived from cleaned point-in-time fundamentals — ROCE, ROE × earnings retention, F-score, margin stability — lagged to publication date so there is no look-ahead.
Of those six categories, the value/valuation block is the only one that overlaps
cleanly with what most retail screening tools already give you. Everything else is
where the alpha lives — and that is the part that does not exist outside ORTEX.
Two strategies, one engine
Both portfolios are run on the same ORTEX Backtester, on the same universe (S&P 500),
long-only, rebalanced monthly with dividends reinvested. They differ only in
which factors they emphasize:
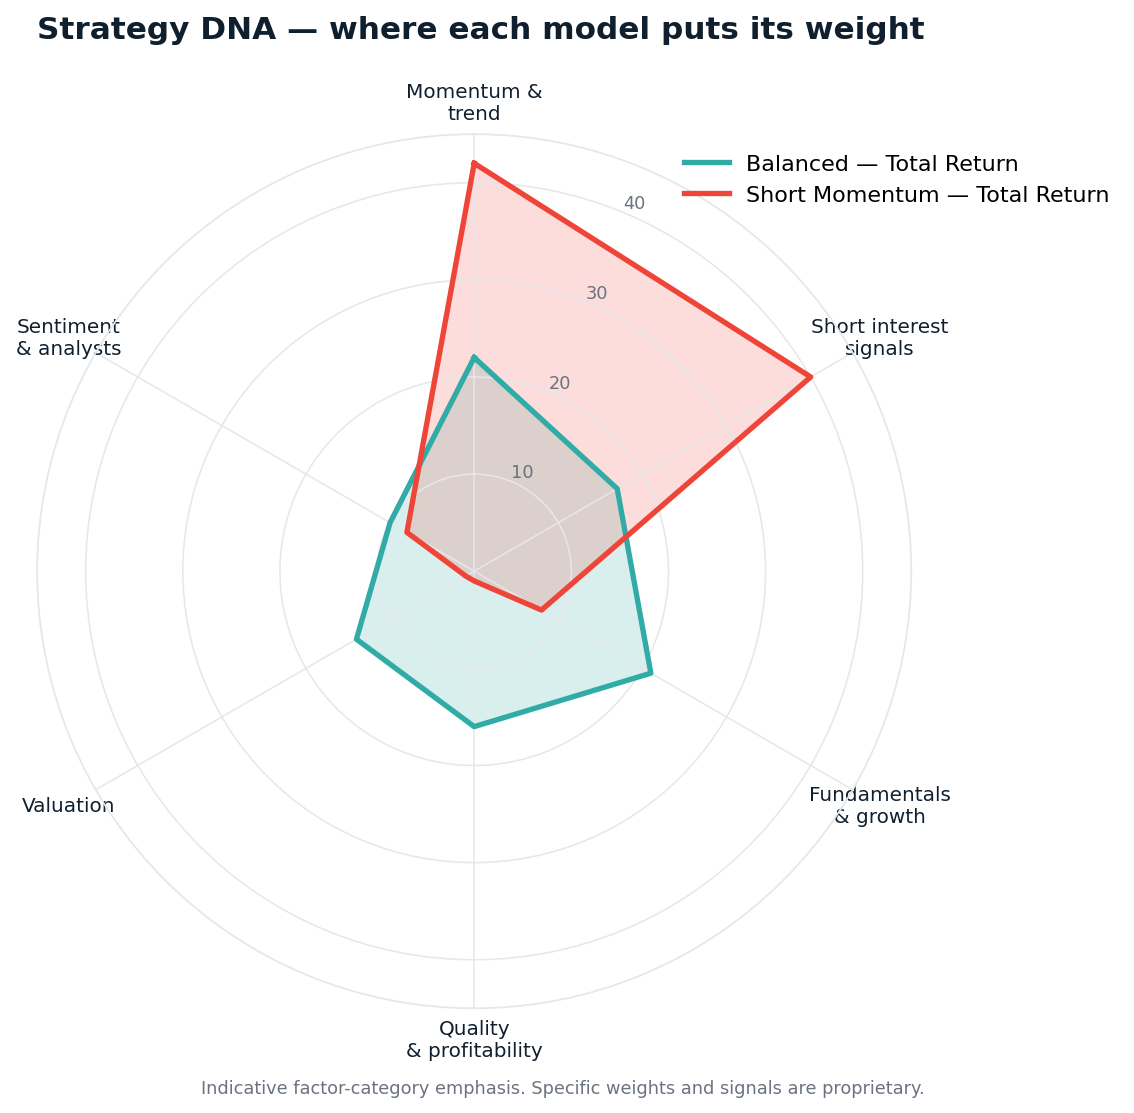
Indicative factor-category emphasis. Specific weights and signals are proprietary.
- Balanced — Total Return holds the top 25 names by composite score
with diversified factor exposure across all six categories. It’s the all-weather build. - Short Momentum — Total Return holds the top 20 names and
concentrates emphasis on price-trend signals plus ORTEX-proprietary short-interest data.
It’s designed to ride names that combine an established uptrend with elevated short
pressure — historically a powerful combination for forward returns.
Year-by-year, the strategies just keep showing up
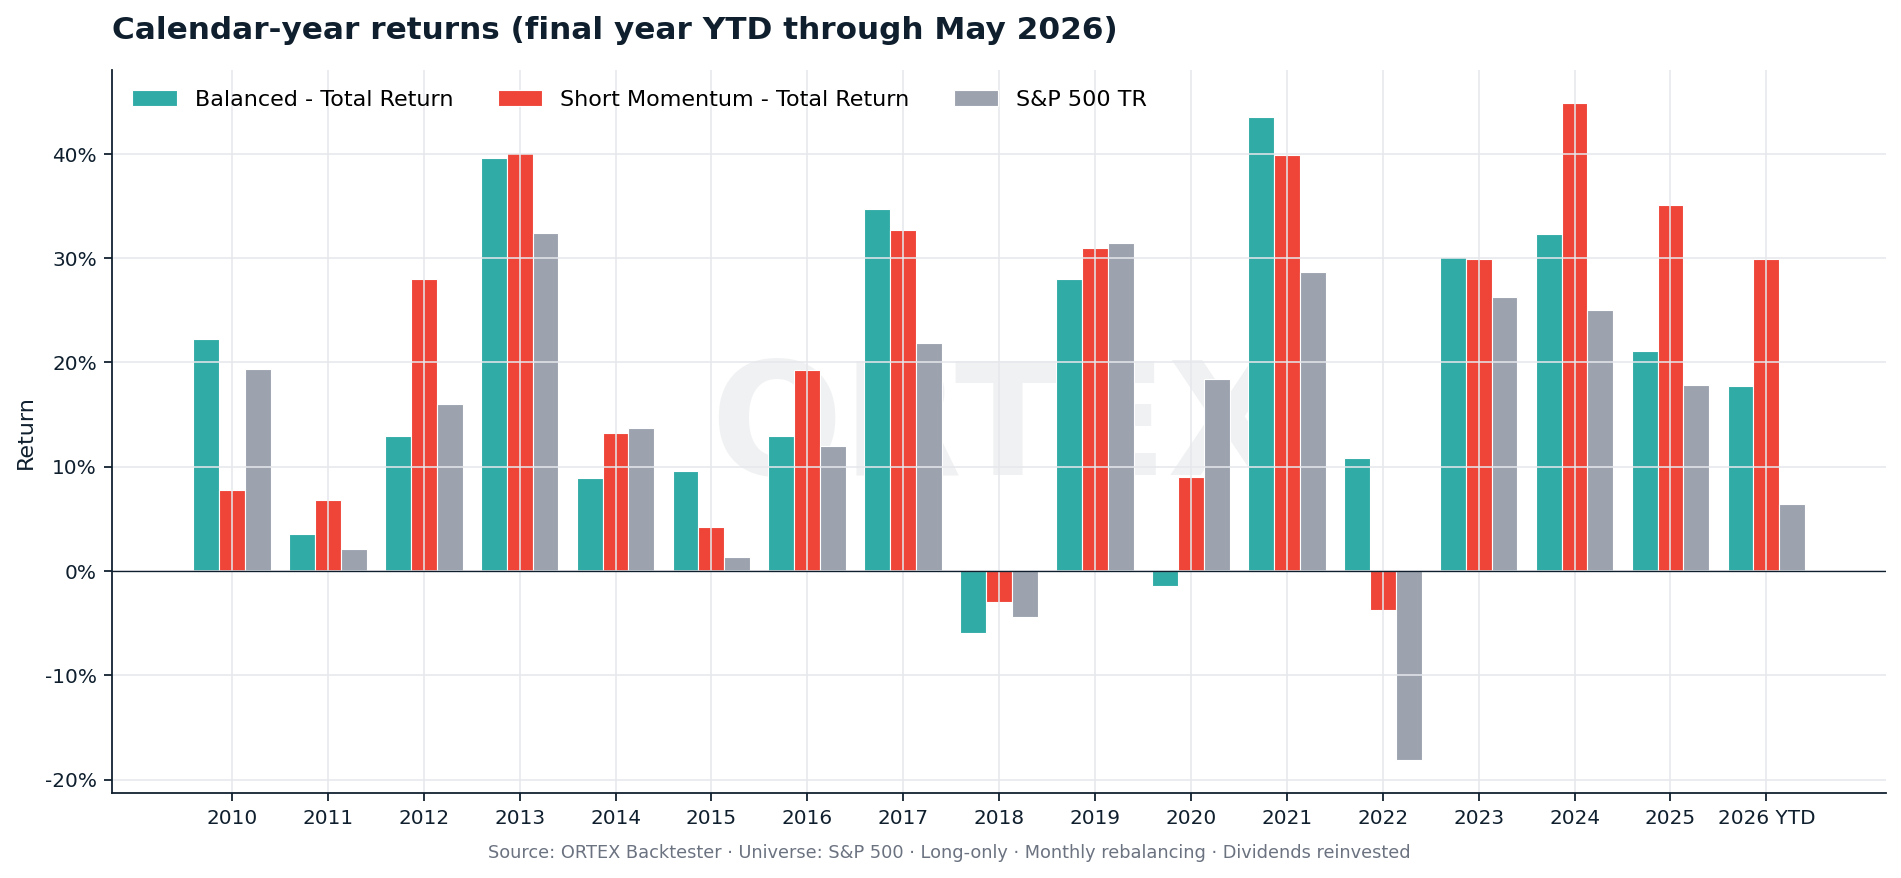
Calendar-year total returns. The 2026 bar is YTD through May 6 — not a full year.
What makes the strategies compound so well isn’t a single moonshot year — it’s a long
string of years where they meaningfully beat the benchmark. 2013, 2017, 2021, 2024
were standout years (+30 to +45% for Short Momentum). 2018 and 2022 were the only down years
for the strategies, and 2022 was less negative than the index.
Higher absolute returns at comparable risk-adjusted rates
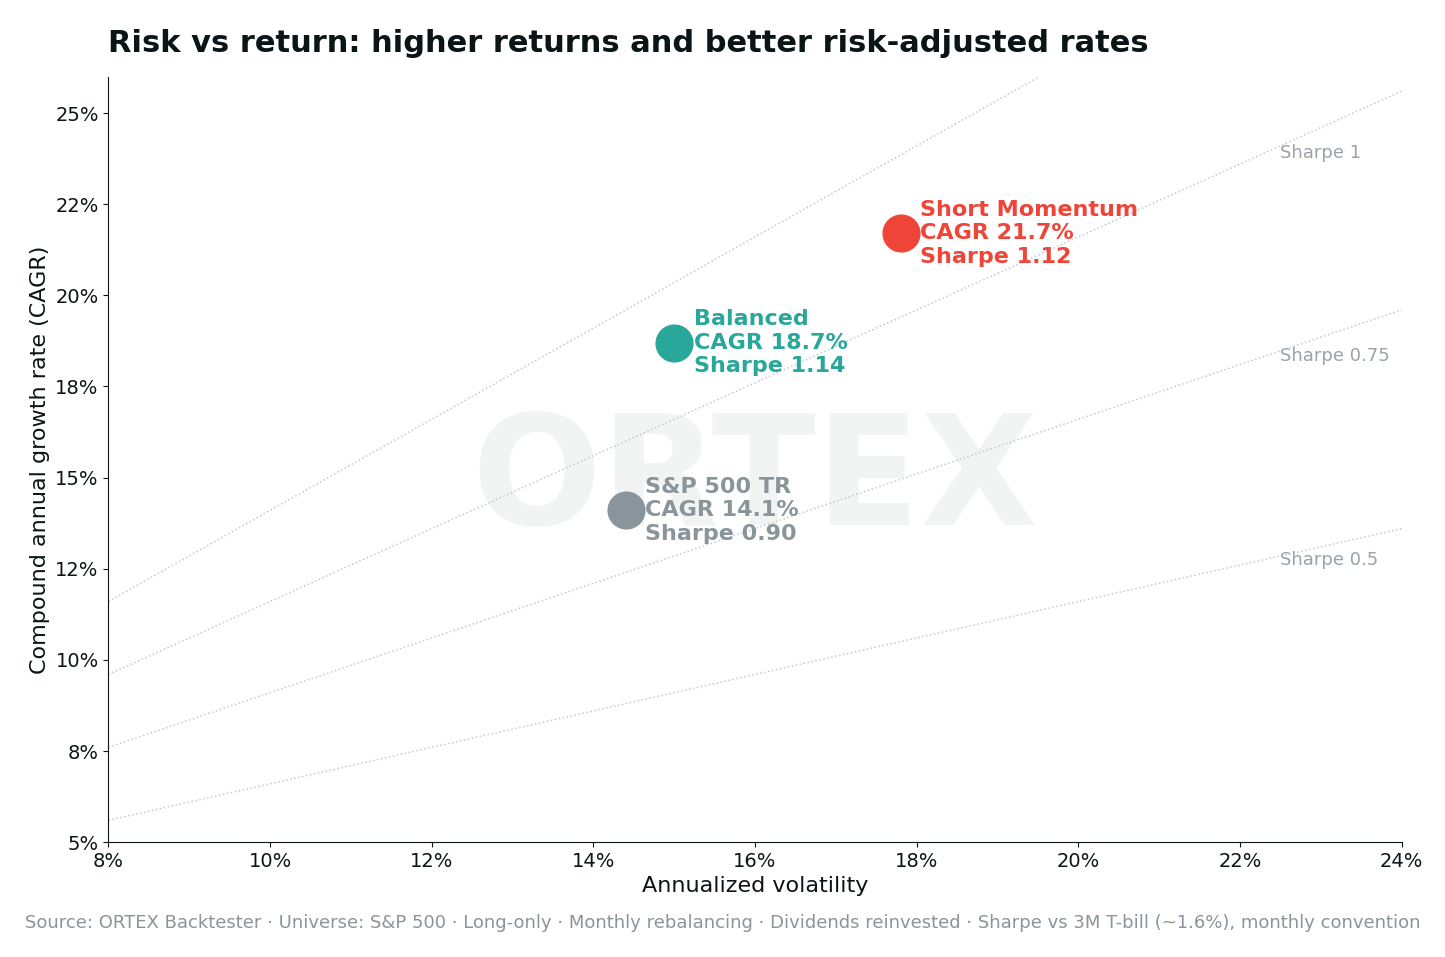
Risk vs return over the full 16.3-year sample. Iso-Sharpe lines shown for reference.
The natural pushback on big return numbers is “okay, but how much risk did
you take?” Volatility on the Balanced strategy is roughly in line with the
index (15.0% vs 14.4%); Short Momentum runs a little higher (17.8%). Sharpe ratios are
above the benchmark — 1.14 and 1.12 vs 0.90 for the S&P 500 TR
over this unusually strong period — meaning the higher absolute returns came with
proportionally more risk, not fundamentally better risk-adjusted performance. In a
single-factor regression against the S&P 500 TR, both strategies still produce
positive annualized intercepts (alpha of 5.7% and 6.3%) with beta close to or
below one, so they earned more dollars than their beta would imply. Further
factor-attribution work would be needed to isolate the proprietary-signal contribution
from standard momentum, quality, sector and size exposures.
Drawdowns: not painless, but recoverable
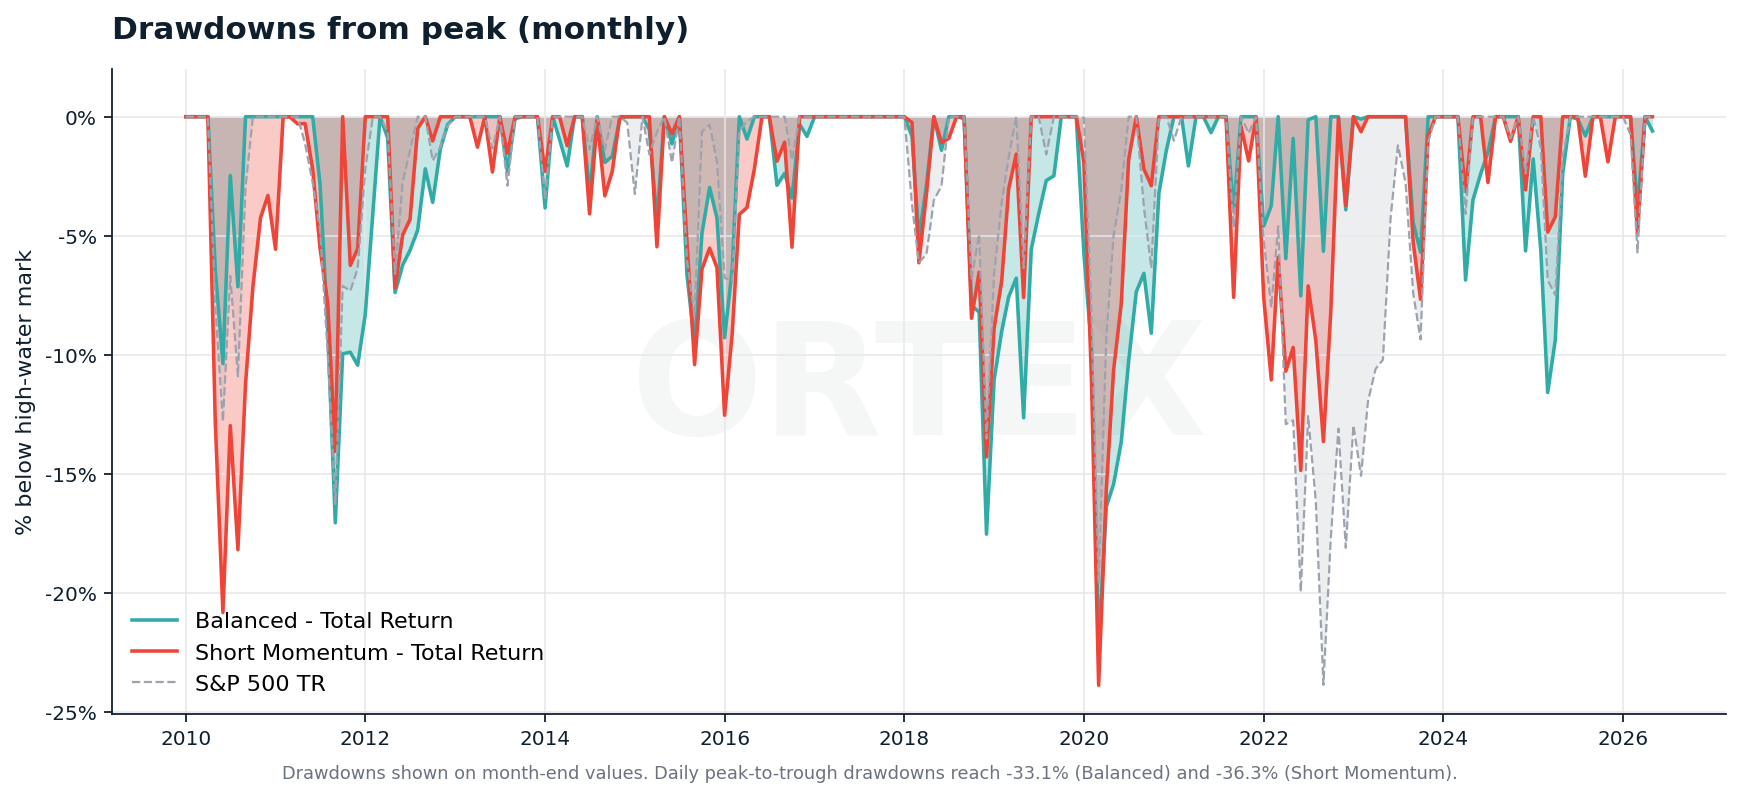
Drawdowns measured on month-end values. Daily peak-to-trough drawdowns hit -33% to -36% in 2020.
Both strategies hit their max drawdown during the COVID-19 crash of March 2020,
alongside everything else in the world — -33.1% for Balanced, -36.3% for Short Momentum,
-33.7% for the S&P 500 TR. By year-end 2020, both strategies had recovered all of it and then some.
Score-driven strategies don’t dodge market crashes. The historical backtest does show
faster recovery periods after several major drawdowns, consistent with the strategy
rotating each month into stronger-ranked names rather than holding the full index.
Pure outperformance, in one line
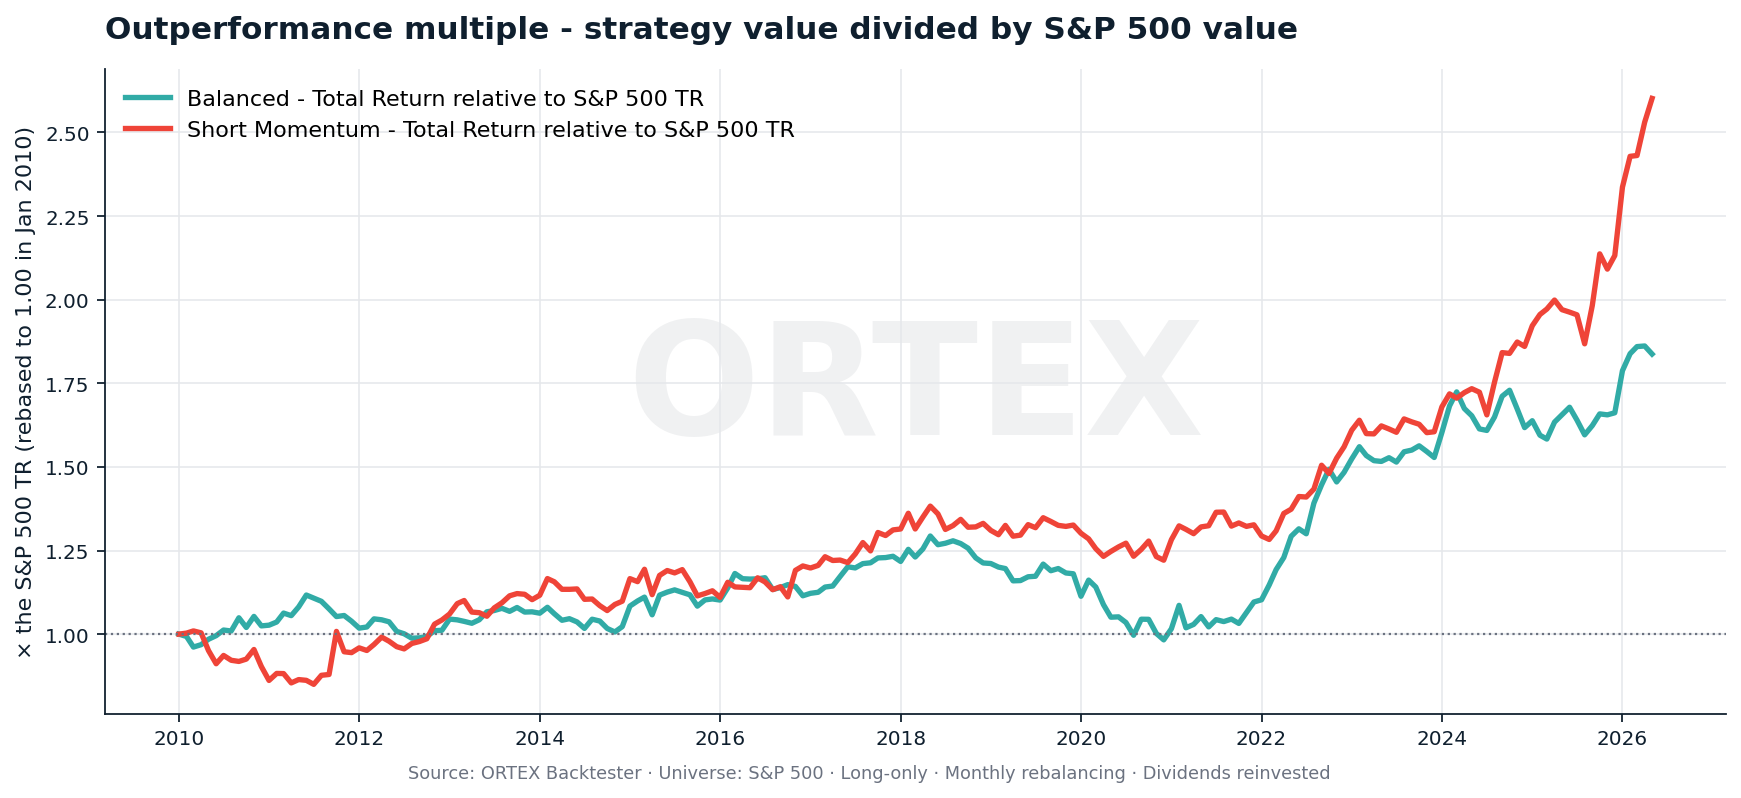
Strategy value divided by S&P 500 Total Return Index value, both rebased to 1.00 in January 2010.
This is the single cleanest view of benchmark-relative compounding. It shows what a
dollar invested in each strategy would be worth relative to a dollar in the
Total Return Index. A flat line at 1.00 would mean tracking the index. Above
1.00 means the strategy has compounded more dollars per dollar invested.
By May 2026, the Balanced strategy is worth 1.89× the S&P 500 TR
and Short Momentum is worth 2.85×. That is the historical effect of
applying the score systematically over the test window.
Technical scorecard
For anyone evaluating a quantitative strategy, the question is never just
how much did it return? The table below adds the metrics most often used
alongside CAGR. Alpha measures absolute return after stripping
out beta-implied market exposure; information ratio measures
the consistency of relative performance; Sortino measures
downside volatility; Calmar measures the relationship between
return and drawdown. Together they help separate the size of the return from
market sensitivity, consistency, downside risk and drawdown severity.
| Metric | Balanced | Short Momentum | RSP EW proxy | S&P 500 TR |
|---|---|---|---|---|
| Total return (gross) | +1,536% | +2,360% | +565% | +764% |
| CAGR (gross) | 18.7% | 21.7% | 12.3% | 14.1% |
| Final value of $1,000 | $16,358 | $24,596 | $6,646 | $8,642 |
| Multiple of S&P TR dollars | 1.89× | 2.85× | 0.77× | 1.00× |
| Annualized volatility | 15.0% | 17.8% | 15.7% | 14.4% |
| Annualized alpha vs S&P 500 TR | +5.7% | +6.3% | -2.0% | 0.00% |
| Annualized alpha vs S&P 500 EW | +8.2% | +9.4% | 0.00% | — |
| Beta to S&P 500 TR | 0.89 | 1.04 | 1.04 | 1.00 |
| Information ratio (vs TR) | 0.47 | 0.67 | — | — |
| Tracking error (annualized) | 7.9% | 9.6% | 4.9% | — |
| Sharpe ratio (Rf ≈ 1.6%, 3M T-bill) | 1.14 | 1.12 | 0.74 | 0.90 |
| Sortino ratio (downside-only) | 1.17 | 1.21 | — | — |
| Calmar ratio (CAGR / |max DD|) | 0.56 | 0.60 | 0.31 | 0.42 |
| Max daily drawdown | -33.1% | -36.3% | -39.0% | -33.7% |
| Max drawdown date | Mar 2020 | Mar 2020 | Mar 2020 | Mar 2020 |
| Years beating S&P 500 TR (of 16) | 12 (75%) | 13 (81%) | 6 (38%) | — |
| Months beating S&P 500 TR | 54% | 56% | 47% | — |
| Holdings | 25 | 20 | ~500 | 500 |
| Rebalance | Monthly | Monthly | Quarterly | — |
Period: 2010-01-04 → 2026-05-06 · 4,107 trading days · 16.33 years (2026 partial / YTD).
All figures are gross of transaction costs unless explicitly noted.
How to read those numbers
Alpha > 0 means the strategy earned more than its beta-implied share of the market.
The alpha figures shown are vs both the cap-weighted S&P 500 TR and the equal-weighted
variant — both are positive — so the result is not simply “equal-weighting a top-N S&P
portfolio”. Information ratio above 0.5 is generally considered respectable;
above 1.0 is exceptional. The strategies sit between 0.47 and 0.67 versus the cap-weighted TR
benchmark and higher than that versus equal weight. A full factor-attribution exercise (vs
momentum, quality, size, value and low-volatility benchmarks) would be needed to fully isolate
the proprietary-signal contribution from known factor premia.
Point-in-time validation and controls
This is not presented as a live trading record or a pre-registered fund strategy.
It is a point-in-time historical simulation showing that ORTEX stock
scores, used systematically inside a simple long-only S&P 500 selection framework,
have historically identified portfolios with materially better absolute return and
benchmark-relative compounding than the S&P 500 Total Return Index, with comparable
risk-adjusted metrics and strong drawdown recovery. Each rebalance used only information
available on or before the rebalance date. Figures are gross of transaction costs unless
explicitly noted.
- Long evaluation window, limited reliance on fitted parameters.
ML-derived sub-signals (momentum-ML, quality-ML, value-ML) account for a minority
of the composite weight; the rest is rule-based across fundamentals, technicals
and ORTEX short-interest data, none of which were tuned against the 2010–2026
window. That makes the 16.3-year evaluation period long relative to the parameter
set being tested, but does not by itself constitute proof that the strategies
were specified before the period began. - No look-ahead at any rebalance. Each monthly rebalance uses only
stock-score data that was published to the platform on or before the rebalance
day. Fundamentals are lagged to publication date, not fiscal-period date. - Survivorship-bias-free universe. S&P 500 universe membership
is reconstituted each month using historical constituency, so removed names still
appear in the universe in the periods when they were members. - Selection-bias caveat. These are two illustrative configurations
from the ORTEX Backtester — readers should treat them as historical simulations,
not as live, pre-registered track records. A full robustness review should compare
them with alternative parameterisations and standard factor benchmarks.
What about transaction costs?
The headline figures are gross. For a top-25/top-20 monthly-rebalanced strategy in
S&P 500 names, friction is small but not zero. Below is the approximate CAGR drag
at three illustrative monthly turnover bands and four round-trip cost assumptions.
Realized holdings-level turnover was not measured for this brief, so the turnover bands
are illustrative rather than measured.
| Assumption | 5 bps | 10 bps | 25 bps | 50 bps |
|---|---|---|---|---|
| Balanced — net CAGR (gross 18.7%) | ||||
| 20% monthly turnover | 18.56% | 18.42% | 18.00% | 17.31% |
| 40% monthly turnover | 18.42% | 18.14% | 17.31% | 15.93% |
| 60% monthly turnover | 18.28% | 17.86% | 16.61% | 14.56% |
| Short Momentum — net CAGR (gross 21.7%) | ||||
| 20% monthly turnover | 21.56% | 21.41% | 20.99% | 20.28% |
| 40% monthly turnover | 21.41% | 21.13% | 20.28% | 18.87% |
| 60% monthly turnover | 21.27% | 20.84% | 19.57% | 17.47% |
Even under aggressive 60% monthly turnover and 50 bps round-trip cost assumptions,
Short Momentum remains above the S&P 500 Total Return Index’s 14.1% CAGR
(17.10%), while Balanced is broadly in line with the benchmark (14.34%). Realized
holdings-level turnover was not measured for this brief; assumed bands are illustrative.
Why we’re publishing this
We’re not selling these specific strategies as products. We’re showing what
becomes possible when you have ORTEX-quality short-interest, fundamental and
sentiment data at your fingertips, blended into a single signal that updates
every day.
Inside ORTEX, every subscriber sees the same stock scores and runs the same
backtester that produced these results — on any universe, any factor weights,
any rebalance frequency they like. The two strategies in this brief are
illustrative configurations, not the only way to use the engine.
Build your own version — beat the market, your way
Don’t just take our weights — build your own. ORTEX subscribers can pull every
stock score (current and full history) directly from the API, blend factors with
whatever weighting you believe in, and run the backtester to see if your version
can beat ours.
API reference:
docs.ortex.com/reference/stock_stock_scores_list
· pull current and historical composite stock scores for any
ticker, drop them into your own model, and out-perform the index on your own
terms.
Technical brief
Download the full 18-page PDF
All charts, full methodology, backtest controls, cost sensitivity and disclosures (~1.3 MB).
See live ORTEX Stock Scores. Build your own strategies.
Browse current scores, run your own backtests, and see the same data behind
these results — including ORTEX-proprietary short-interest signals you won’t
find anywhere else.
Important disclosures. The performance figures above are the result of
a historical backtest run on the ORTEX Backtester from 2010-01-04 to 2026-05-06
(16.33 years, 4,107 trading days; the 2026 calendar year is YTD). They are not an
actual trading record, do not include taxes, brokerage fees or borrowing costs, and
are gross of any management fee unless explicitly noted in the cost-sensitivity table.
Strategy NAV is computed from split-adjusted daily close prices with cash dividends
credited on ex-date and reinvested at the next rebalance — dividends are not
double-counted in the price series. Each rebalance uses only data that was available
on or before the rebalance date (no look-ahead). S&P 500 universe membership is
reconstituted historically using point-in-time constituents. The cap-weighted benchmark
is the S&P 500 Total Return Index (dividend-reinvested, daily and
monthly); the equal-weighted benchmark is the Invesco S&P 500 Equal Weight ETF
(RSP, dividend-reinvested monthly closes). The two strategies presented are
illustrative configurations of the ORTEX scoring engine and should be treated as
historical simulations, not as live, pre-registered track records. Past performance
is not indicative of future results. Equity strategies of this type can experience
drawdowns of 30%+ and did so during the COVID-19 crash of March 2020. This article
is informational only and is not investment, tax, legal or financial advice.
See ORTEX data live.
The same proprietary data behind this article, on the platform, by API and in Excel.
Try ORTEX free →