Alpha Trading Signals
Every day ORTEX identifies alpha-generating opportunities. These are identified through rigorous analysis and validated through back-testing. The Alpha trading signal will tell you how much return has historically been made and the optimal holding period and relative success of this signal in the past. ORTEX back-test data sets in infinite combinations and bring you the highest-ranked signals across over 50,000 stocks every day. These signals are the ones that are most likely to happen again and produce the highest return in the shortest time. ORTEX Alpha signals are split into five families Short Squeeze, EPS, RSI, MACD and Company Events. Some of these signals families have multiple types. The different types of signal look at different aspects of the metric that is the main base for that signal.
For more information about our signals and the performance of them please read our blog post here – http://13.217.11.75/trading-signals/
Trading Signals Table
These shows all the recent signals in the stock you are looking at. Per default the table is sorted by date, with the most recent on top. You can click the table headings to change the sorting and also filter the table with the text boxes in the header or the sliders. The filtering you set here also affects the below Trading signals chart, so you can for example write RSI in the trigger box, to only see the RSI signals on the chart and in the table.

LIST OF COLUMNS
DATE
The date the Signal is or was effective from and triggered on the previous days close.
TRIGGER
The type of Signal that has been fired. ORTEX Alpha signals are Short Squeeze, EPS, RSI, MACD and Company Events
EPS – There are three types of these signals, they are all based on changes in analysts EPS estimates but the three different types look at slightly different perspective of this.
Short Squeeze –comes in Type1, 2 and 3. They look at slightly different aspects of how to detect a Short Squeeze, considering everything from Short Interest, Utilization, Cost to Borrow and the Stock Price as well as the rate of change in these.
RSI – Comes in 3 different types which looks at different aspects of RSI. They are all fired when an extreme relative level is triggered that has historically produced a strong and predictive subsequent move.
MACD – This signal is based on MACD, it looks at multiple ratios over multiple time periods and fires when an extreme relative level is triggered that has historically produced a strong and predictive subsequent move.
SIGNAL RETURN
The average mean return that the signal has historically generated.
RECOMMENDED HOLDING DAYS
This is calculated to maximize return and minimizing holding time. The number shown is the number of trading days it has historically been best to hold the position for. You can click on the signal to see more details about this in the “Percentiles and recent trading signals” chart.
MEAN RETURN
This shows the historical mean return for all of the past signals.
RETURN OVER TIME
The mean average return of the signal is plotted over a relevant time frame so users can visualise the reasoning behind the recommended holding days. Hover over the chart to see days and return.
TRIGGERS PER YEAR
Total number of times the signal has triggered divided by the number of years the signal has been back-tested for.
SUCCESS
This shows how many times this signal has triggered in the past and the percentage of those triggers that have moved in the intended direction.
SIGNIFICANCE
Significance is a score out of 100 displayed as 0-5 stars with 100 or 5 stars being the highest. The signals are rated based on the largest return over the shortest time combined with the frequency and success of previous signals.
SHOW ON CHART
Click this to draw this signal type on the “Percentiles and recent trading signals chart”
TRADING SIGNALS CHART
The chart is labelled with the historical signals and the letter of the signal that has been fired, e.g E is EPS and R is RSI. The border of the signal box indicates if it’s a buy or a sell signal, green for buy and red for sell. You can hover over each signal to see the details and can filter the chart as you amend options in the columns above.

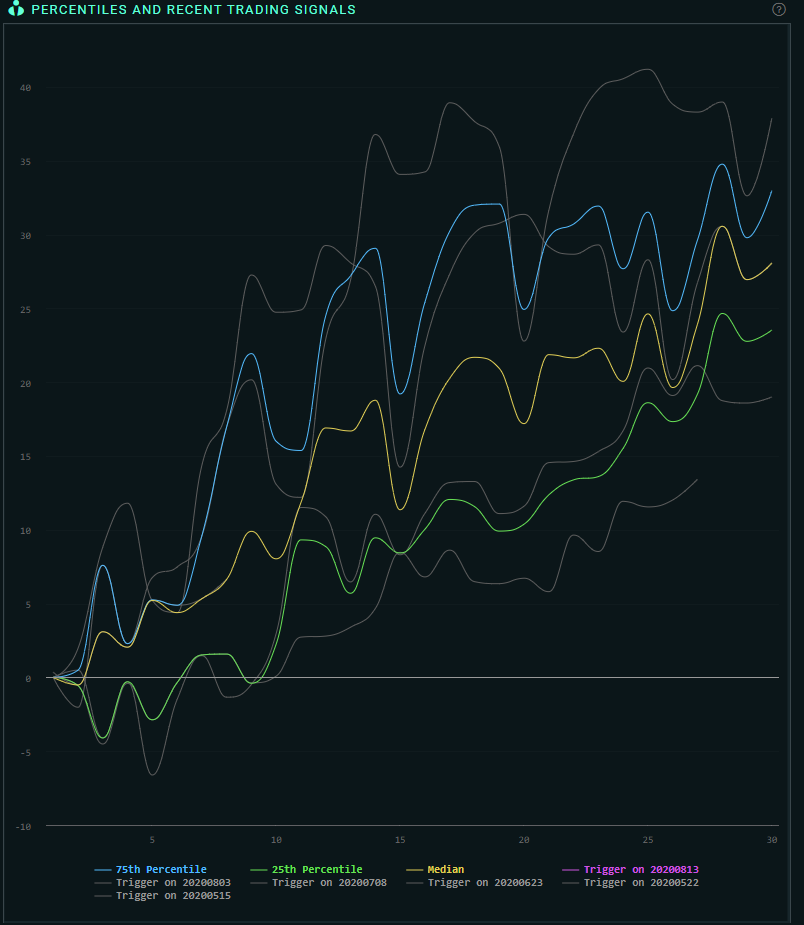
PERCENTILES AND LAST SIGNALS
This chart shows you the percentage moves of the stock in the days following all the previous times the signal was triggered. Each line chart represents a previous signal and you can see % return versus days. You can see from the chart axis, the date on which the signal was fired or you can hover over the lines.