Historical events chart
This chart shows the company’s price with company events plotted on it. As always users can change the time frame on the grey axis and click an event on the legend to hide or show in on the chart.
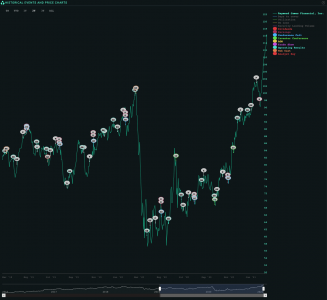
This chart shows the company’s price with company events plotted on it. As always users can change the time frame on the grey axis and click an event on the legend to hide or show in on the chart.
ORTEX Research · Backtest Brief $1,000 → $23,555 in 16 years.What score-driven stock selection has shown historically. Two long-only S&P 500 strategies, picked by ORTEX…
The story behind the data, written the moment it changes. We’re launching ORTEX Market Intelligence — a new way to consume the data you already…
Your data. Your way. Anywhere you need it. We’re thrilled to announce that ORTEX data is now available via API and our brand-new Excel Add-in.…
Explore More with Our Upgraded Short Interest Chart We’re excited to announce a major upgrade to our Short Interest charting experience on ORTEX! Designed with…
Palantir, Axon, and MicroStrategy join the index, while Moderna, Illumina, and Super Micro Computer exit According to ORTEX’s latest analysis, the upcoming December 2024 Nasdaq-100…
Discover the Stocks You’ve Been Searching For with ORTEX’s Enhanced Screener We’re excited to unveil an innovative enhancement to the ORTEX platform: our newly upgraded…
ORTEX Perspectives on the S&P 500 for January The stock market kept its winning streak alive as all the major averages closed out January…
ORTEX Perspectives on the S&P 500 for December The stock market finished 2023 with a bang as the S&P 500 climbed for nine weeks…