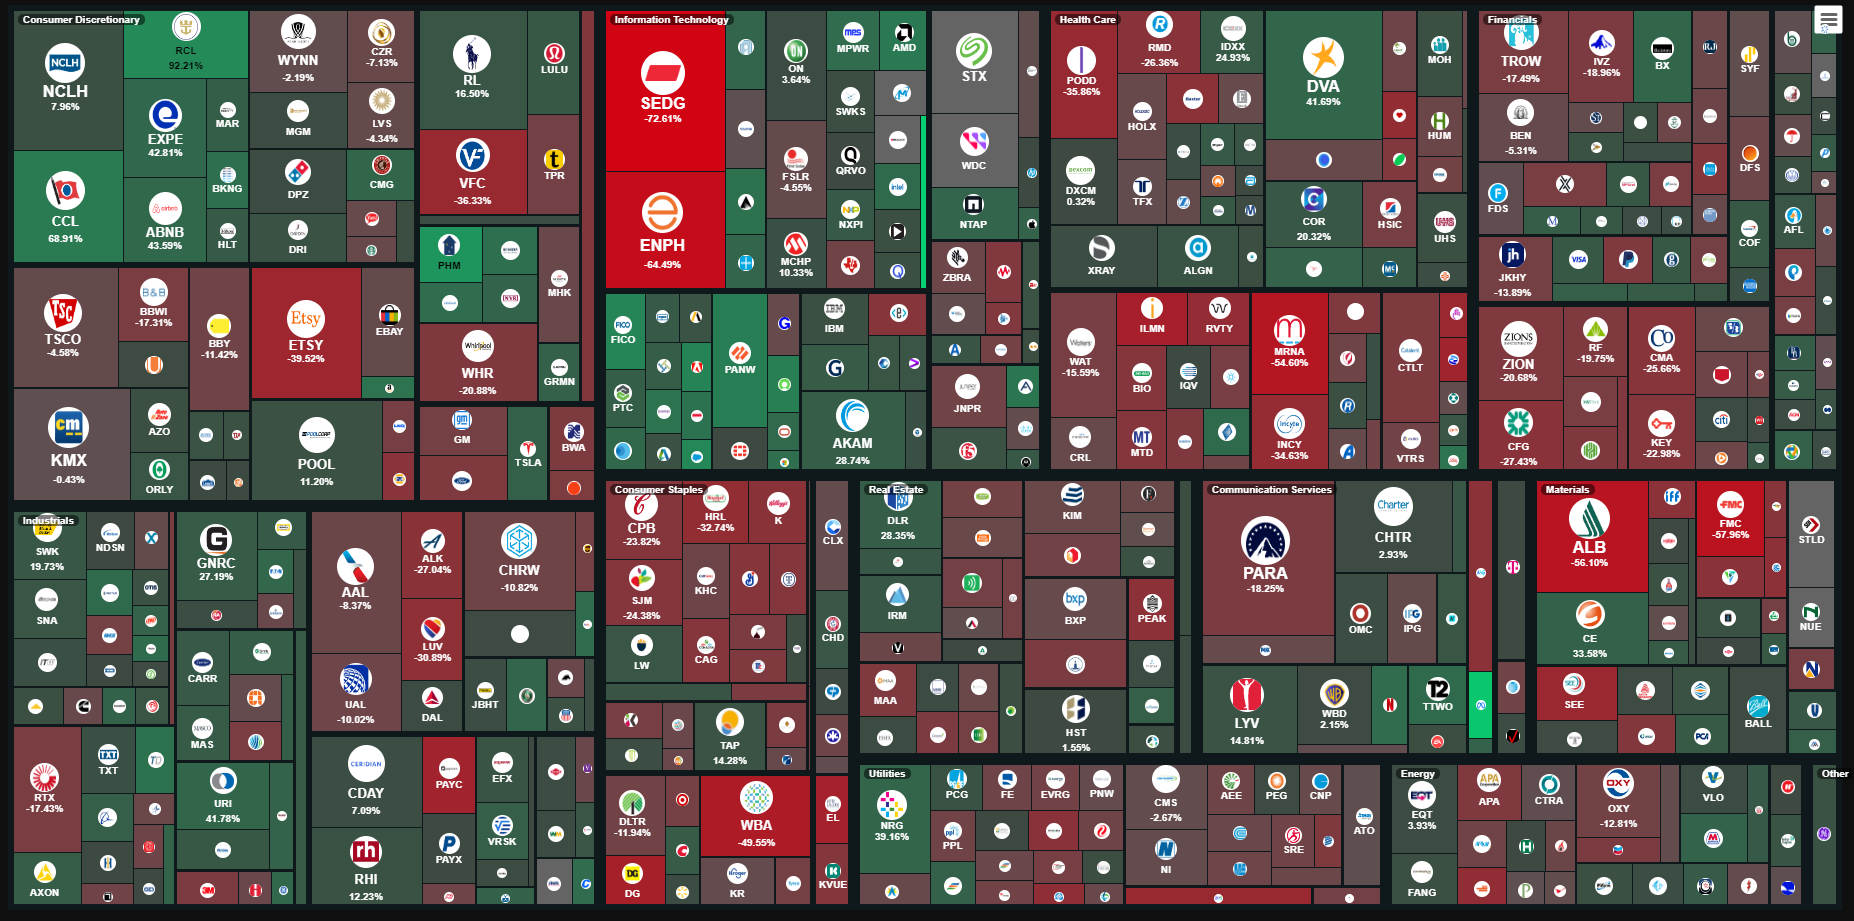
Unveiling Market Dynamics: Exploring ORTEX Short Interest Heatmap

In the fast-paced world of finance, staying ahead of market trends is crucial for investors. One tool that has gained prominence in recent years for analyzing market sentiment and potential price movements is the Heatmap. ORTEX Short Interest Heatmap is an innovative visualization tool that offers a unique and comprehensive way to understand short interest in the stock market, providing valuable insights for traders and investors.
Before delving into the ORTEX Short Interest Heatmap, it’s essential to grasp the concept of short interest. Short interest refers to the total number of shares of a particular stock that have been sold short by investors. Short selling involves borrowing shares and selling them with the expectation that their price will decrease, allowing the investor to buy them back at a lower price and profit from the difference.
The ORTEX Short Interest Heatmap
Our Short Interest Heatmap offers a dynamic and interactive way to explore short interest information across various stocks, sectors, and industries. Here’s a closer look at its key features:
- Color-coded:
The heatmap is divided into different sectors, with stocks included in their specific sectors. These stocks are then given a distinct color, with a colour legend running along the bottom of the page. By default, these stocks are colored by short interest percentage of free float. This allows users to quickly identify the stocks that are experiencing higher levels of short interest. A glance at the heatmap provides a bird’s-eye view of the market landscape. - Tile Size Significance:
By default, the size of each tile within the heatmap corresponds to the market capitalisation of a particular stock. Larger tiles indicate higher market capitalisation, while smaller tiles represent lower market capitalisation. This feature helps investors pinpoint stocks that are potentially under the influence of short sellers. - Hover-over Details:
Hovering over a specific tile reveals detailed information about the corresponding stock, including its name, short interest percentage of free float, and other relevant metrics. This interactive element enables users to gather insights about individual stocks within the heatmap. - Live Updates:
ORTEX Short Interest Heatmap provides real-time data, ensuring that investors have access to the most current information. This feature is invaluable for those who want to make timely and informed decisions based on the latest market conditions. - Customizable Filters:
Users can customize the heatmap based on specific criteria, such as market cap, volume, or short interest percentage. Users can adjust the index the heatmap refers to, and what metrics the heatmap is sized by and coloured by. This flexibility allows for a more tailored analysis, catering to the unique preferences and strategies of individual investors.
Benefits for Investors
The ORTEX Short Interest Heatmap empowers investors in several ways:
- Identification of Market Trends:
By visually analyzing the heatmap, investors can identify trends in short interest across different sectors. This insight helps them stay ahead of market movements and make informed decisions. - Stock Comparison:
The heatmap’s proficiency in swiftly unveiling a stock’s short interest level offers investors immense value. Its seamless ability to facilitate effortless comparisons between individual stocks within the same sector and index further enhances its utility, providing investors with unparalleled insights for informed decision-making. - Risk Mitigation:
Understanding short interest levels aids in assessing the level of risk associated with a particular stock. Investors can use this information to adjust their portfolios and implement risk mitigation strategies. - Timing Trades:
Real-time updates enable investors to time their trades more effectively. Being aware of changes in short interest can be crucial for making decisions that align with market dynamics.
Conclusion
The ORTEX Short Interest Heatmap stands as a valuable tool for investors seeking a deeper understanding of short interest dynamics in the stock market. Its user-friendly interface, real-time updates, and customizable features make it an indispensable resource for both seasoned traders and those new to the world of finance. By harnessing the power of visual analytics, investors can gain a competitive edge and navigate the complexities of the market with confidence.