Introducing Credit Default Swap Data

ORTEX believes that data empowers investors to make informed investment and trading decisions, which is why we work continuously to add more and more datasets to our platform. Following the recent addition of Index Rebalance Predictions, we are introducing another dataset that provides a different perspective on a company’s financial condition: Credit Default Swaps (CDSs).
What are CDSs?
CDSs were created nearly three decades ago as a way for credit investors to manage credit risk. These derivatives, which primarily trade over-the-counter (OTC), allow counter parties to transfer risk, allowing the buyer to essentially purchase protection from an adverse credit event (such as a default) that may occur. Since CDSs are structured with ongoing premium payments, they are often compared to insurance products.
If the specified credit event occurs, the CDS seller will compensate the buyer. There are different types of credit events that can trigger the payout. Like many OTC derivatives, these contracts are customized and negotiated based on each party’s specific needs. CDSs became more prominent after playing a role in the 2008 financial crisis, as many bearish investors utilized them as vehicles to successfully speculate on the collapse of the subprime mortgage industry.
CDSs represent the vast majority of all credit derivatives – by far. The notional amounts of credit derivatives in the second quarter of 2022 was $4 trillion, according to the U.S. Comptroller of the Currency, with CDSs comprising $3.36 trillion of that total.
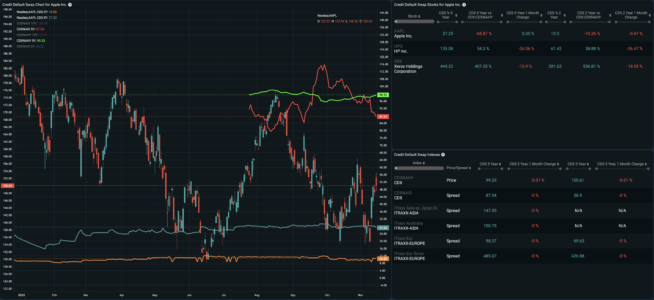
CDS data for AAPL
How can I use CDS data?
While CDSs are most relevant to credit investors, the data can be useful for a broad range of investors. The credit market is generally known to be more sophisticated than the equity market when it comes to pricing in risk, so CDS pricing can be informative in assessing a company’s risk profile.
That’s especially true for any company that carries a lot of debt, which can be an important consideration for equity investors since creditors have a higher claim on company assets in the event of financial distress. CDS pricing data and trends are meaningful market signals that can offer another perspective on company fundamentals.
For example, rising CDS prices show that the market is becoming more concerned about a company’s ability to meet its debt obligations. That information can be triangulated with other data points, such as interest coverage ratios or debt-to-equity ratios, among others, as part of a comprehensive investment analysis.
Studies have shown that changes in CDS spreads can be predictive for short-term stock returns. For instance, a sharp increase in the spread between short-term and long-term CDS prices can potentially indicate future credit deterioration that is not being reflected in current stock prices. Spreads can widen for a number of reasons, including macroeconomic and company-specific factors.
CDS data can be found in a brand new primary module as well as under the new CDS tab when looking at a stock on ORTEX.
