Short Interest Chart
By ORTEX Research
The Short Interest chart highlights the share price versus various Short interest metrics.
The default chart shows DTC versus stock price but users can click on the legend on the right to chart other metrics including Utilization, Cost to Borrow, Shares on Loan and Freefloat on Loan. You can find definitions for these terms at the bottom of this help window.
ORTEX highlight Ex-dividend dates on the chart so users can identify how a dividend usually affects the shares on loan. Users can often identify a short-term spike over a dividend as investors loan the stock for tax reasons.
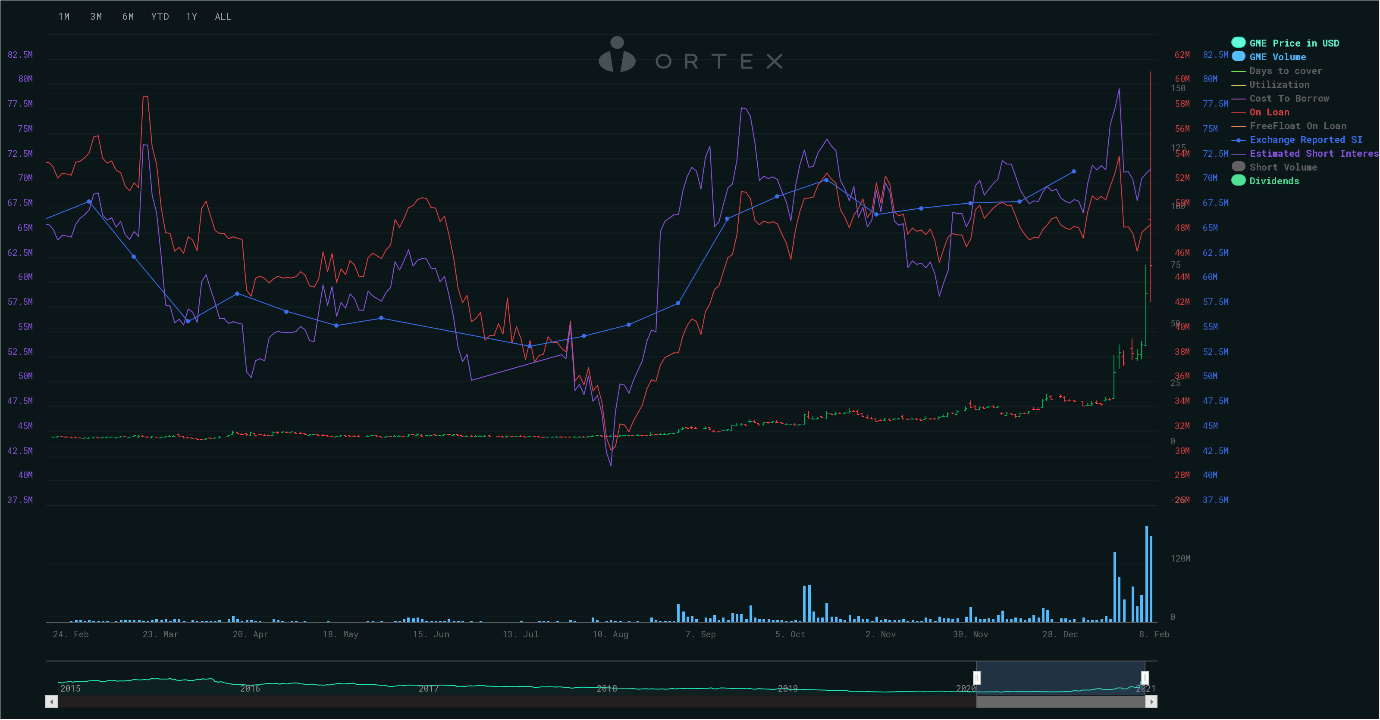
Users can add more data to this chart by clicking on the green icon above the chart options. In addition, all the data on the chart can be exported.
The chart highlights daily stock volume along the bottom of the axis.
Days to Cover 3m (on loan)
How many days of average volume the current shares on loan equate too. This average daily volume is based on the 3 month daily volume for the given security across exchanges. Days To Cover (DTC) is also know as Short Interest Ratio.
Days to Cover 2w (on loan)
This DTC figure is based on the average 2 week daily volume for the given security across exchanges. Days To Cover (DTC) is also know as Short Interest Ratio.
Utilization
The ratio between the number of shares on loan across all outstanding loans in the wholesale market and the number of shares available for lending at lending programs. 0% means that no shares have been borrowed or lent at these lending programs; 100% means that all shares available to borrow or lend at a lending program have, in fact, been lent. This does not represent the number of shares listed on the exchange that have been lent, because not all listed shares are available for lending; it indicates how much of the supply actually available for lending has been lent. Unless otherwise specified, this is given in decimal format.
Cost to borrow
The average annualised % of interest on loans from Prime brokers to their clients, i.e. hedge funds.
On Loan
The current number of shares out on loan.
% FreeFloat on Loan
The percentage of the companies freefloat that is currently out on loan.
On Loan – Avg. Age (d)
The average number of days that current loans have been outstanding on the given date. This is weighted by the number of shares in each loan.
On Loan – Number of Loans
The number of loans that are outstanding on the given date.
Exchange Reported SI (US )
The number of shares the exchange has reported as being shorted. This number is reported delayed by the exchange and is only reported twice a month.
Flagged Shorts (Europe)
In Europe users can also chart the aggregated total FLAGGED shorts. Again this helps to put all the information available in one place.
Estimated Short Interest
The ORTEX estimate of the number of shares that are shorted.
This uses the delayed official exchange data and is adjusted by the relevant percentage change of our intra-day stock lending data to give users another useful estimate of the very latest daily short positioning.
Estimated SI % of FF
The ORTEX estimate of the % of the companies free floating shares that are shorted.
Days to Cover 1w/2w/1m/3m (estimated SI)
How many days of average volume the current estimated short interest equate to.
Security Lending Volume
This is the security lending volume and the sum of all shares returned to lenders and all shares lent.
Failure To Deliver
This is the aggregated number of shares that have failed to be delivered and is still not delivered, by either participant in a trading contract, at the point in time. A failure to deliver can occur when a short seller does not own the stock and can therefore not deliver it, there can be other reason why a stock fails to be delivered and therefore fails-to-deliver are not necessarily the result of short selling or “naked” short selling. Values are released twice a month, the first half of a month is normally made available at the end of the month and the second half of the month is normally made available around the 15th of the next month.
Advanced
DTC 1m (on loan)
This DTC figure is based on the average 1 month daily volume for the given security across exchanges.
DTC 1w (on loan)
This DTC figure is based on the average 1 week daily volume for the given security across exchanges.
CTB – MIN/MAX/STD – All
The minimum, maximum and standard deviation annualised % of interest on loans from Prime brokers to their clients, i.e. hedge funds.
CTB – AVG/MIN/MAX/STD – New
The average, minimum, maximum and standard deviation annualised % of interest on loans issued that day from Prime brokers to their clients, i.e. hedge funds.
CTB – AVG/MIN/MAX/STD – Returned
The average, minimum, maximum and standard deviation annualised % of interest on loans returned that day.
On Loan – New/Returned
The current number of new shares out on loan, and the current number of shares on loan that have been returned.
On Loan – Avg. Age – New/Returned
The average age of the current number of new shares out on loan, and the average age of the current number of shares on loan that have been returned.
See ORTEX data live.
The same proprietary data behind this article, on the platform, by API and in Excel.
Try ORTEX free →