Live Price Chart
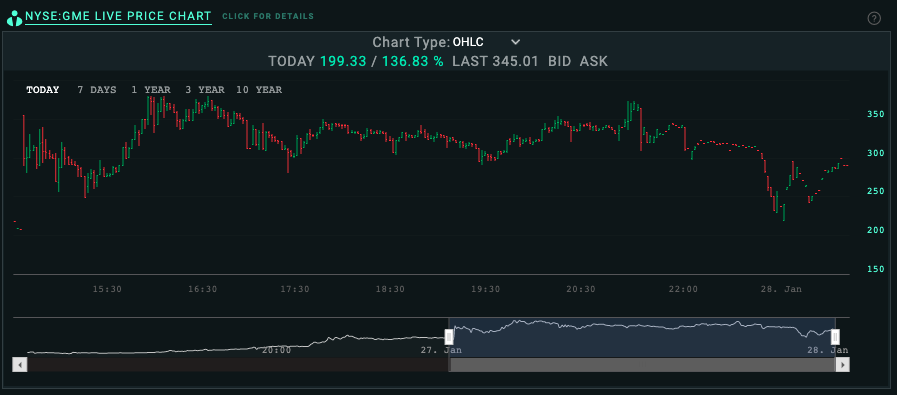
The price chart defaults to show todays price changes from the open. If the market has not yet opened, it will show the previous trading day..
On top of the chart you can see todays price development, as well as the last price and the current bid and ask.
You can change to look at more history by clicking the “7 Days”, “1 Year”, “3 Year” or “10 Year” button on the top.
You can use the date selector at the bottom to select a smaller period, or just drag on the chart itself to select a period of interest.
If you prefer a line chart or a candlestick, rather then the default OHLC, you can change this at the top of the box.
If you click on the header of this box you get taken to a full page chart, where you can also use more advanced charting tools, showing technical indicators as well as overlaying other data.