Trading Signals Chart
By ORTEX Research
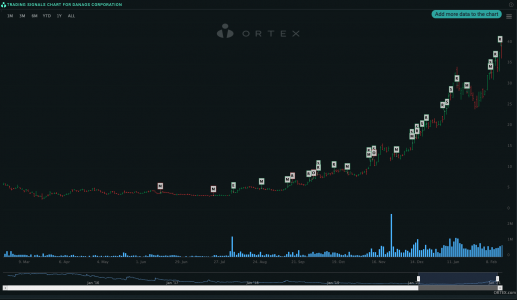
The chart is labelled with the historical signals and the letter of the signal that has been fired, e.g E is EPS and R is RSI. The border of the signal box indicates if it’s a buy or a sell signal, green for buy and red for sell. You can hover over each signal to see the details and can filter the chart as you amend options in the columns above.
See ORTEX data live.
The same proprietary data behind this article, on the platform, by API and in Excel.
Try ORTEX free →