Short Interest Overview
By ORTEX Research
Short statistics and trends are a crucial element in understanding how a stock behaves and how sentiment surrounding a stock is developing. ORTEX Short interest data is sourced from the world’s largest combined pool of Agent Lenders, Prime Brokers, and Broker-Dealers who submit their inventory.
In the US, stock exchanges only offer short interest data twice a month and this data is also delayed with over a week, leaving investors in the dark regarding daily short selling activity. ORTEX fills this void with daily up‑to‑date information from the global securities finance market and enables users to gauge changes in investor sentiment. This data is updated by 7.30am EST each day with current stock borrows – you wont find more timely or accurate data.
In addition, In Europe, financial institutions are required to flag to the local regulator whenever they go over or back under certain thresholds. This provides valuable and timely additional data. ORTEX add these flags intra-day as soon as the regulator publishes them. ORTEX aggregate an institutions overall current short position and lists all the latest flags so you users get an accurate idea of latest sentiment.
Please click the help icon on each box for more specific information on what each data point is.
If you are looking for detailed short interest for any particular stock or ETF, go to the stocks main page by searching for it on the top of the page, and click the heading on the short interest module to get more details.
Information on this page
Security Lending data
On top of the page as well as on the chart, you have securities lending data. For more information about this box, please click the question mark in the top right corner of the box. 
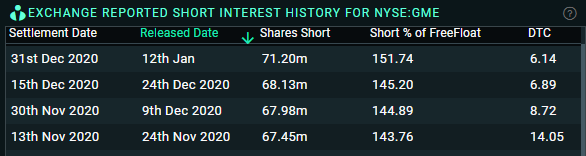
US – Exchange Reported Short Interest
For us listed stocks only, we have a table of the latest US exchange released data. This data can also be charted by clicking the labels on the chart legend.
For more information about this box, please click the question mark in the top right corner of the box.
Europe – Flagged Short Positions
For European listed stocks, we have the regulatory flagged positions. Short sellers with a position over 0.5% must report this to the regulator. This data can also be charted by clicking the labels on the chart legend, or the chart icon next to a holder.
For more information about this box, please click the question mark in the top right corner of the box. 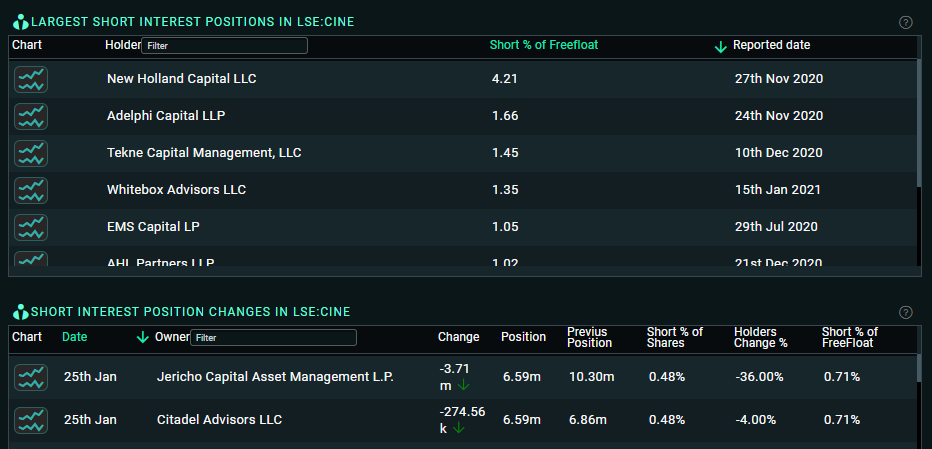
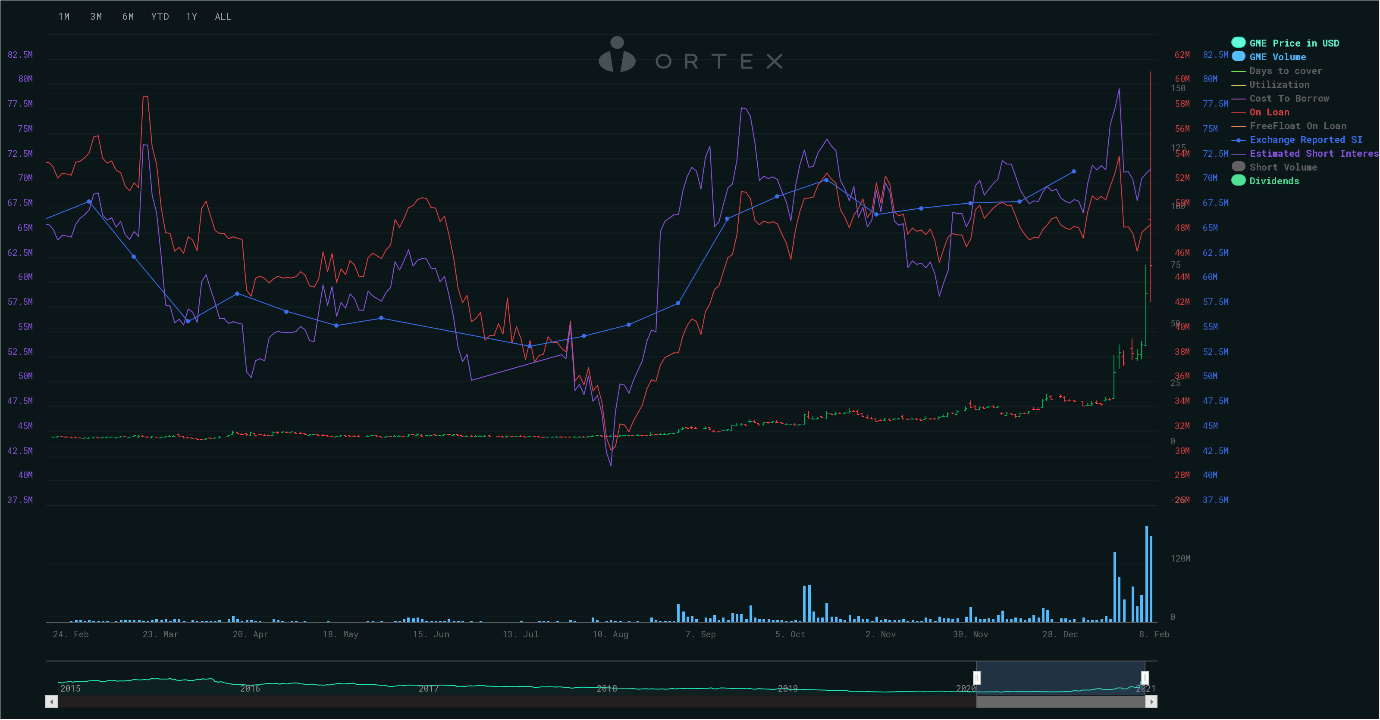
The Chart
Here it all comes together, see the trends, compare all the data. For more information about the chart, please click the question mark in the top right corner of the chart.
Vocabulary on this page
DTC
DTC or Days To Cover is the number of shares shorted divided by the average daily volume. A high DTC therefore indicates that it’s harder to buy the shares back and hence close out a short position.
Cost to Borrow
The average annualised percentage of interest on loans from prime brokers to their clients, i.e hedge funds.
FreeFloat
Free float or public float represents the portion of shares of a corporation that are in the hands of public investors as opposed to locked-in shares held by promoters, company officers, controlling-interest investors, or governments.
FreeFloat on Loan
The percentage of the companies public available shares, FreeFloat, that is currently out on loan.
See ORTEX data live.
The same proprietary data behind this article, on the platform, by API and in Excel.
Try ORTEX free →