Trading Signals
Every day ORTEX identifies alpha generating opportunities. These are identified through rigorous analysis and validated through back-testing. The Alpha trading signal will tell you how much return has historically been made and the optimal holding period and relative success of this signal in the past. ORTEX back-test data sets in infinite combinations and bring you the highest ranked signals across over 50,000 stocks every day. These signals are the ones that are most likely to happen again and produce the highest return in the shortest time.
For more information about any signal, you can click on the signal.
For more details about today’s signals and to be able to look at signals further back you can click on the header.
Columns
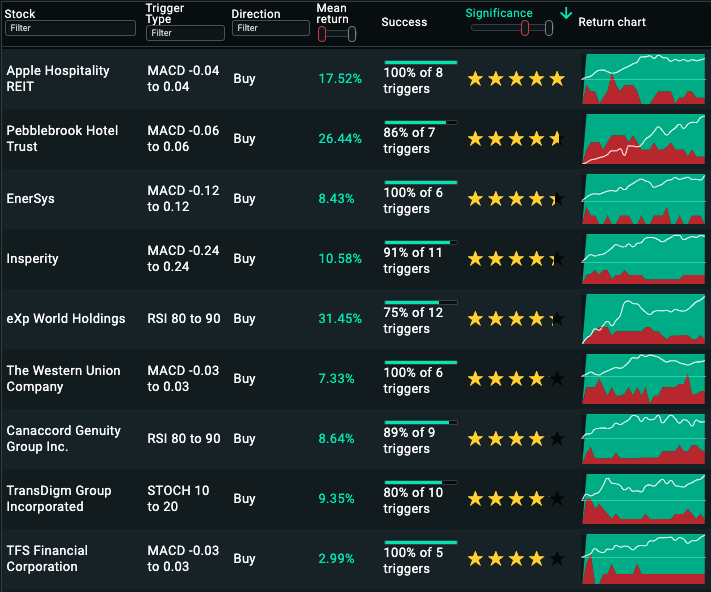
TRIGGER TYPE
The type of Signal that has been fired. ORTEX Alpha signals are EPS divergence signals (EPS), P/E signals (P/E), short interest signals (Short Increase), RSI, STOCHASTIC (STOCH) , MACD and an ORTEX technical,(ORTEX, which is a combination of the various Technical signals that has provided strong historical returns when back-tested).
DIRECTION
Indicates whether the trigger is suggesting a buy or sell trade.
MEAN RETURN
The average mean return that the signal has historically generated. Signals are only generated where triggers have worked historically, hence the mean return is always positive.
SUCCESS
This shows how many times this signal has triggered in the past and the percentage of those triggers that have moved in the intended direction.
SIGNIFICANCE
Significance is a score out of 100 displayed as 0-5 stars with 100 or 5 stars being the top rated signal. The signals are rated based on highest return over shortest time combined with the frequency and success of previous signals.
RETURN CHART
The return chart shows the predicted success, risk and return levels for every day of the recommended holding period of the signal.
Signal Types
EPS divergence signals fire when the consensus of analysts EPS estimates diverge significantly from the share price and this divergence historically reverts and leads to strong alpha generating opportunities.
P/E Signals fire when a historically attractive/unattractive P/E level is reached (vs its own history and peers) that tends to lead to a reversion.
Short Increase signals show when there is a specific increased level of Shares on loan, which tends to be followed by an underperformance in the stock price.
Technical signals RSI, STOCH, ORTEX and MACD are fired when an extreme relative level is triggered that has historically produced a strong and predictive subsequent move.