PULSE
OPTIONSAPPAPP: $28.6M of unusual calls and putsOPTIONSIRENIREN: $128.1M of unusual calls and putsOPTIONSNVDANVDA: $899.9M of unusual calls and putsOPTIONSLITELITE: $157.7M of unusual calls and putsOPTIONSCICI: $3.7M of unusual callsOPTIONSBEBE: $201.5M of unusual putsOPTIONSAMDAMD: $534.5M of unusual calls and putsOPTIONSSPCXSPCX: $345.9M of unusual calls and putsOPTIONSAXONAXON: $3.0M of unusual callsOPTIONSWMTWMT: $16.6M of unusual callsOPTIONSSTXSTX: $69.0M of unusual calls and putsOPTIONSARMARM: $155.0M of unusual callsOPTIONSAAPLAAPL: $294.9M of unusual callsOPTIONSDELLDELL: $236.4M of unusual putsOPTIONSPLTRPLTR: $285.1M of unusual callsOPTIONSMETAMETA: $467.1M of unusual callsOPTIONSMRVLMRVL: $150.1M of unusual calls and putsOPTIONSTSLATSLA: $406.0M of unusual calls and putsOPTIONSECHOECHO: $3.9M of unusual calls and putsOPTIONSVV: $4.8M of unusual callsOPTIONSCRWVCRWV: $453.8M of unusual putsOPTIONSPANWPANW: $58.2M of unusual callsOPTIONSMUMU: $1.9B of unusual calls and putsOPTIONSASSTASST: $4.3M of unusual calls and putsOPTIONSBABA: $17.0M of unusual putsOPTIONSSNDKSNDK: $745.0M of unusual putsOPTIONSBACBAC: $20.4M of unusual putsOPTIONSMSTRMSTR: $124.2M of unusual calls and putsOPTIONSXYZXYZ: $2.9M of unusual putsOPTIONSAMATAMAT: $56.7M of unusual calls and puts
The ORTEX platform · for individual investors and traders

ORTEX data, on your screen.

The same proprietary data professional desks license, in a platform built for the way you trade: live short interest, the options platform, stock scores, signals, a backtester and ORTEX AI, in the browser and on your phone.

Free account in under a minute. No card required.

AMAMDNasdaq · Advanced Micro Devices, Inc.
LIVE
SI % of Free Float
2.39%
Cost to Borrow
0.47%
Availability
Ample
Days to Cover
1.72
ORTEX Options PlatformNew

The only options chain with short interest on it.

Options flow and unusual options activity, gamma exposure (GEX), IV rank, max pain and expected move, next to the ORTEX short interest data that explains them. A full chain with live Greeks across every expiry from 0DTE to LEAPS, plus earnings implied-move and IV-crush history.

And analyze the trade before you place it: build any multi-leg strategy and see the full P&L curve, at expiry or any date in between, with probability of profit computed for you. The return potential of a complex spread becomes a picture, not guesswork.

01
Short interest on the chain
SI % of free float, days to cover and the borrow fee, next to every strike. Context that changes the trade on any crowded name.
02
The ORTEX Short Score
One balanced 0–100 number that weighs everything affecting a stock's short interest. A high score means the setup for a potential squeeze is in place; from there it just needs a catalyst, usually a rising price.
03
SI + open interest overlay
Thirty days of short-interest change and options OI build-up on one axis, to spot positioning before it becomes a headline.

A $9.90/mo add-on to any ORTEX plan (shown in your local currency). Launch offer: half price for your first 6 months.

NVDA · Options chainExample data
SI % FF 1.3%Borrow fee 0.4%Days to cover 0.9GEX +$2.1BIV rank 58
Call OIIVStrikeIVPut OI
12.4K62%14058%8.1K
31.2K57%14555%19.6K
24.8K59%15054%11.3K
Short Score 87 · Squeeze setup in place, waiting on a catalyst. Max pain $142 · Expected move ±6.8% into earnings.

See where your risk ends and your opportunity begins.

The strategy analyzer turns any position into a picture. Below: a call butterfly on TSLA, anchored to the live price. The white line is your profit and loss at expiry, the curves show today and any date you pick, green is where the trade wins and red is what it risks. Breakevens, max profit, max loss, Greeks and probability of profit are computed for you and update as the price moves. And when you need candidates, the IV screener and the Short Score surface the setups worth analyzing in the first place.

TSLA · Strategy analyzerTesla, Inc. · NasdaqExample strategy · live TSLA price
Spot $394.41Expiry 2026-11-20DTE 35dCall butterfly 365/400/435Debit $7.10Max +$2,790.00 / -$710.00Prob. of profit 32%
-$1k0$1k$2k$3k$320$340$360$380$420$440$460$480Max +$2,790Max -$710BE $372.10BE $427.90$394.41
At expiryTodayAnalysis dateOpportunityRiskStrategy is illustrative · spot is live
The platform

A terminal built for the way you actually trade.

Screen every dataset we hold, track positioning in real time, and ask ORTEX AI what changed and why. All of it in the browser, at a fraction of the cost of a terminal seat.

01
Stock stamps
Price, shorts, options, insiders and events on one card per stock. The most active names float to the top on their own.
02
ORTEX AI: ask the data
Ask a question in plain English and get an answer grounded in live ORTEX data, with the figures behind it.
03
Screen everything
Build screens on any dataset we hold, then download the results.
Unusual options activityExample data
NVDANov 20 $200 CBUY$4.2M
CIBRDec 18 $72 CBUY$1.1M
BHPNov 20 $60 CBUY$880K
QSRNov 20 $65 PSELL$640K
Alpha trading signal★★★★★Example data
Avg return
+14.2%
Success
78%
Hold
9d
ORTEX AI & MCP · Ask the data

Stop digging through screens. Just ask the data.

ORTEX AI turns billions of live data points into a conversation. Ask a question in plain English and get an answer grounded in real ORTEX data: short interest, options, fundamentals, analyst moves and events across global markets. It reads the numbers the way an analyst would, so every answer arrives with the data behind it, not a guess.

Ask

Plain-English questions. “What changed on NVDA this week?” comes back with the actual figures, sourced to the data.

Compare

Put names, sectors or timeframes side by side without building a screen or exporting a thing.

Investigate

Pull a thread. Drill from a headline number down into the short interest, options and flow that drive it.

No prompt engineering, and every answer comes with the underlying ORTEX figures. Prefer to build your own models? The same data ships by API and CSV.

Or bring ORTEX into your own AIMCP

ORTEX MCP connects the same live data to Claude, ChatGPT and any assistant that speaks the Model Context Protocol. Authorize ORTEX in one click and your AI can call short interest, the Short Score, options, stock scores and events as tools, reasoning over the real figures right inside your own chat. Explore ORTEX MCP →

ORTEX AI & MCPgrounded in live data
Which names on my watchlist have rising short interest and a falling cost to borrow into earnings?
Three names fit right now. Short interest is climbing while borrow is getting cheaper, into earnings:
TickerSICTBEarnings
PLTR2.7% ↑0.16% ↓Nov 2
TSLA2.4% ↑0.38% ↓Oct 21
NVDA1.3% ↑0.17% ↓Nov 18
Example for illustration.
ORTEX forecasts · Index Rebalance

See the forced trades before they’re announced.

Passive funds overtook active in early 2026, and around $13 trillion now tracks the S&P 500 alone. When a stock joins or leaves an index, those funds have to trade it at any price. ORTEX forecasts which stocks move in and out before the official announcement for 131 indices across 22 markets, MSCI included, every trading day before the open, with a conviction score from 0 to 0.99 and an estimate of the passive flow each change will trigger.

131
indices in 22 markets, MSCI included
85%
calls right the day before the announcement*
2018
forecast history from
$13T
tracks the S&P 500
S&P 500 / 400 / 600US Tech 100Russell 1000 / 2000S&P/TSX CompositeFTSE 100 / 250STOXX Europe 600EURO STOXX 50DAX / MDAX / SDAX / TecDAXOMX StockholmFTSE/JSE Top 40Nikkei 225S&P/ASX 200Hang SengTaiwan 50KOSPI 200NIFTY 50MSCI World / EM+ 22 more

Index Rebalance add-on: $67 a month paid annually ($799 a year), or $99 month to month. Requires ORTEX Advanced. Launch offer: 50% off your first 3 months.

*10,302 of 12,133 add and delete calls, every scheduled review since 2018 across 46 indices, rebuilt point in time and scored against the changes the providers published; 82% three weeks out. Scores as at 14 October 2026. Past performance is not a guide to future results.

S&P 500 · next reviewExample data
StockActionConvictionImpact
APPADD0.94$2.1B
DELLADD0.88$1.6B
SMCIDROP0.81$0.9B
The rows above are example data, shown for illustration. Conviction runs 0–0.99 and settles to 1.0 once verified; impact is the estimated passive buying or selling. Live forecasts are delivered daily before the open, via CSV and API.
ORTEX models · Stock Scores

The whole S&P 500, ranked every day.

One daily score per stock, built from hundreds of data points: ORTEX short-interest data, momentum and value rankings, analyst and sentiment moves, fundamentals and technicals, weighed by machine learning and AI. It is the view a quant desk builds in-house, ready to screen, sort and download.

Use it your way: screen and rank on the platform, or pull every score, current and historical, over the API and feed your own model with your own weights.

Backtest 4 Jan 2010 to 15 Oct 2026 (16.8 years), top-ranked S&P 500 names, monthly rebalance, gross of costs. Hypothetical. Past performance is not a reliable indicator of future results.

Stock Score backtest · 2010–todayHypothetical, updated dailyGrowth of $1,000
20102014201820222026
Short Momentum - Total Return+2,495%S&P 500 (TR)+813%
21.4% CAGR2.8× the S&P 500Sharpe 1.12 vs 0.90+1,682% vs S&P
ORTEX BacktesterNew

Would your idea have made money? Now you can find out.

The ORTEX Backtester turns the whole data platform into a laboratory. Describe a trading idea in plain rules, then replay it across years of real market history. No code, no spreadsheets: you see every trade the idea would have taken, and whether it actually worked.

The power is in the inputs. Your rules can draw on the same data professional desks pay for, short interest and cost to borrow, technicals, fundamentals, options activity and corporate events, hundreds of data points and millions of ways to combine them, so you can finally answer questions like: what would buying oversold stocks with rising short interest, and closing them when the pressure eased, have returned?

And when a backtest earns your confidence, switch it on: ORTEX runs the same rules against live data and alerts you when a stock meets them, with the position the strategy would take, ready for you to review and action right away.

01
Pick your universe
A region or one of your portfolios, narrowed by market cap and industry. Up to 2,500 stocks in a single run.
02
Describe the setup you'd buy
In plain rules, no code: price moves, short interest, RSI and MACD, fundamentals, options activity and corporate events, combined with AND / OR.
03
Decide how you exit
Stop loss, profit target, a time-based exit, or a condition that closes the trade when the signal reverses. Set once, or per setup.
04
Run it and read the verdict
ORTEX replays history rule by rule and returns the return, CAGR, Sharpe, drawdown, win rate and a ledger of every trade.
Backtest · RSI < 30 + rising short interestExample data
start+71%
Total return
+71.4%
CAGR
18.9%
Sharpe
1.42
Max drawdown
−12.6%
Win rate
61%
Trades
247
TickerReturnClosed by
CVNA+38.2%Profit target
UPST+21.7%Signal reversed
PTON−8.0%Stop loss
Every trade is logged with its entry, exit and the reason it closed, and rolled up per ticker, best first.

Backtests are hypothetical simulations run on historical data. They do not account for trading or borrowing costs, slippage, taxes or available liquidity, and real results would differ. Any strategy shown is an illustration of how the tool works, not a recommendation to buy or sell any security, and nothing here is investment advice or a personal recommendation. Past performance is not a reliable indicator of future results; the value of investments can go down as well as up, and short selling carries additional, potentially unlimited risk. Data may contain errors, so validate independently before acting. See our Terms & Conditions and the full disclaimer at the foot of this page.

Direct access to market-moving data.

Everything the platform shows, delivered raw. Pull one ticker or the whole universe over the REST API, work in the Python SDK, or pipe live figures straight into Excel. Get up and running in minutes with the Python SDK and a free TEST API key.

Short InterestCost to BorrowFTDOptions & GreeksStock ScoresFundamentalsGov TradesOHLCV
short_interest.sh
$ curl https://api.ortex.com/v1/short-interest/GME \
-H "Authorization: Bearer $ORTEX_KEY"
{
"ticker": "GME",
"si_pct_free_float": 6.7,
"cost_to_borrow": 0.49,
"days_to_cover": 4.6
}
ORTEX MCP · For your AINew

Bring ORTEX into your own AI.

ORTEX MCP connects the ORTEX data platform to Claude, ChatGPT and any assistant that speaks the Model Context Protocol. Your AI gets ORTEX as a set of live tools, short interest and cost to borrow, the Short Score, options, stock scores, fundamentals, government trades and events, and can pull the real figures mid-conversation to answer, compare and investigate.

One click to connect. No API keys to copy or paste. Authorize ORTEX once from your assistant and it's connected, using your existing subscription.

Your data, your plan. The connection is scoped to your ORTEX tier and backed by a dedicated key you can revoke at any time.

Grounded in real figures. Your assistant pulls live ORTEX data as tools and reasons over the actual numbers, not a guess from training data.

Claude + ORTEX MCPConnected
How crowded is the short in GME right now, and what are options saying?
toolortex.get_short_score✓
toolortex.get_cost_to_borrow✓
toolortex.get_options_pcr_sentiment✓
The short looks crowded: a Short Score of 78, short interest around 24% of free float and a cost to borrow near 18%. Options lean bullish, with the put/call ratio easing over the last week.
Short Score
78
SI % FF
24.7%
Cost to borrow
18.4%
Example for illustration.
ORTEX Charts · For your productNew

The chart engine behind ORTEX, for your own data.

We built our own charting engine for the ORTEX platform because nothing on the market handled deep histories, order flow and hundreds of series without slowing down. Now it is a commercial JavaScript library for brokers, trading platforms and research sites. It ships without data: you plug in yours, and it draws it fast and beautifully.

Your data, drawn beautifully. Feed it prices, fundamentals or any time series of your own. Plot as many lines as you need, each on its own axis or pane.

A data menu built in. Users add and remove series from a menu you define. Your own feeds go in it, and ORTEX data can too, through the API, if you want it.

Styled as your product. Colors, fonts, toolbar and layout are yours to set, with no mark on paid plans. White-label and OEM by agreement.

JavaScript shipped to the browserKB gzip

A full trading chart, measured the same way for every library.

ORTEX Charts, full chart89.9
Toolbar, indicators, drawings, order flow
ORTEX Charts, candles + volume59
Legend, price lines, crosshair
Highcharts Stock + stock tools216
The set its own Stock Tools demo loads
33 ms
100k bars
129
indicators
0
dependencies

Measured 5 September 2026. Method and sources on ortexcharts.com/compare.
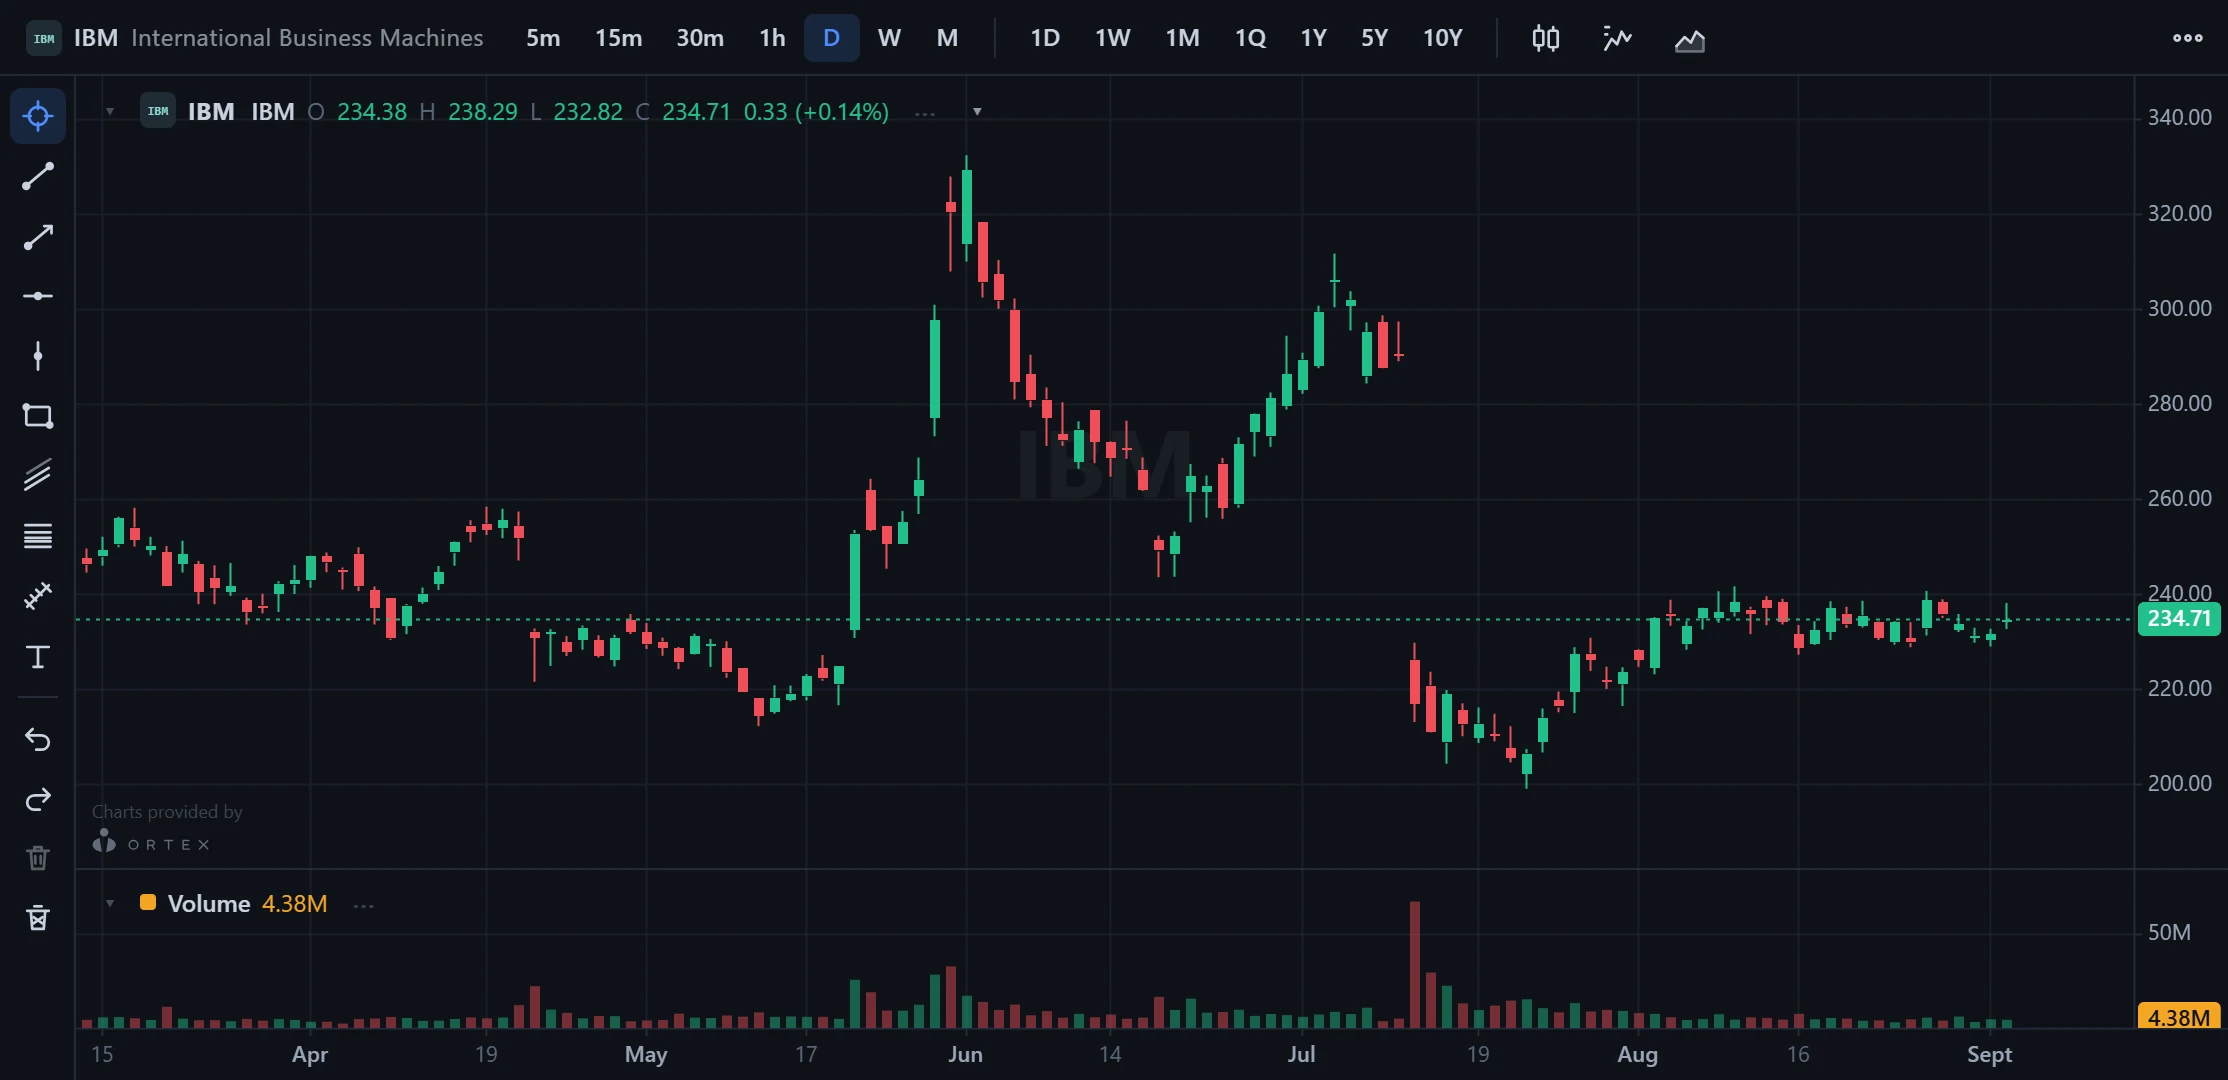
ORTEX Charts with its full toolbar: timeframes, drawing tools, candlesticks and a volume pane
The full chart shell with toolbar, drawing tools and a volume pane, drawing sample IBM data. The library ships without data; in your product it draws yours.
ORTEX News · Market Intelligence

ORTEX Market Intelligence

Enterprise-grade market intelligence generated from ORTEX proprietary data: pulses, earnings previews, trader notes and weekly digests, each one grounded in the numbers and fully sourced.

Explore ORTEX News →
Live from ORTEX News

The story behind the data, the moment it changes.

All stories on ORTEX.news →
MI
Tesla and GM Headline the Week's Big Earnings Slate
Tesla and GM Headline the Week's Big Earnings Slate Tesla reports Tuesday and General Motors on Monday. Both names carry meaningful alternative data signals heading into their prints. German car registration data, which ORTEX Alt Data identifies as leading GM revenue by 15 days with a strong fit, is running +133% on the same quarter last year across all three months…
MI
Euro Factory Slump Deepens as UK Output Breaks Records
Euro Factory Slump Deepens as UK Output Breaks Records Euro-area industrial production fell to an index reading of 97.5 in August. That is the weakest August reading in five years, according to the Eurostat industrial production index. The decline was not a one-month blip. Output has now fallen for three consecutive months. Across the Channel, the picture could not be more different. UK…
MI
Utilities and Defence Lead Analyst Target Cuts
Utilities and Defence Lead Analyst Target Cuts Analysts trimmed targets across utilities and defence sectors Thursday, while energy and industrials saw selective upgrades. Six utility names took coordinated target price cuts. WEC, ED, SRE, PEG, FE, and AEP all saw consensus targets edged lower. The moves were modest…
MI
Corvex Exits Illumina with $203M Dump
Corvex Exits Illumina with $203M Dump Activist fund Corvex Management has been walking away from ILMN. Between August 19 and September 4, Corvex filed 40 separate sell transactions totalling $203M in Illumina stock. The filings became public on September 4. Corvex holds a board seat at the genomics firm. That combination of scale and boardroom access makes the exit hard to…
Pricing

Start free. Upgrade when you need more.

Plans for individual investors and traders, in your local currency. Licensing data for a team? See ORTEX for institutions.

ORTEX Basic
Core datasets for everyday research.
$49/mo
or $468/yr ($39/mo)
Get Basic
✓Real-time news feed, watchlists & global prices
✓Delayed short interest, cost to borrow & days to cover
✓Analysts, institutional holders & insiders
✓Fundamentals, dividends & corporate actions
✓Market Intelligence articles
ORTEX Advanced
Most popular
Real-time everything for active traders and analysts.
$149/mo
or $1,188/yr ($99/mo)
Get Advanced
✓Everything in Basic
✓Real-time short interest & cost to borrow
✓Options data, Greeks & unusual activity
✓Trading Signals & Stock Scores
✓Gov trades, currency & commodity exposures
✓ORTEX AI: ask the data
✓Market Intelligence: trader notes, digests & reports
✓API access included
Add-on to ORTEX Advanced

Index Rebalance

50% off · 3 months

Daily forecasts for 131 indices with honest odds on every name, the move each name needs and the flow in days of volume. Radar, review and trade pages, deals, alerts and the daily brief.

$99/mo, or $799/yr
Launch offer: $49.50/mo for your first 3 months on monthly billing
See the add-on →
Index Rebalance for desks

API, daily files, webhooks and point-in-time history from 2018.

from$497/mo

Prices shown in your local currency where available. Taxes may apply.