See the forced trades before they’re announced.
When a stock joins or leaves an index like the S&P 500 or the FTSE 100, every fund that tracks that index has to buy or sell it, often billions of dollars on a single closing auction. Knowing the names before the announcement lets you position ahead of that forced flow instead of trading against it.
ORTEX forecasts 131 indices in 22 markets every trading day before the open. Every name carries the odds it makes the cut, the price move that decides it, and the flow index funds must trade, in days of the stock’s own volume.
- Published track record
- 85%
- of calls right the day before the announcement, 46 indices since 2018; 82% already right three weeks out1
- US Tech 100
- 98%
- of addition calls right the day before, every review since 2018; 96% of calls right three weeks out1
Index Rebalance add-on: $67 a month paid annually ($799 a year), or $99 month to month. Requires ORTEX Advanced. Launch offer: 50% off your first 3 months.
- A 3.8% fall
- takes it to 25%
- +10.6%
- is even money
- Impl.-day volume, last 8
- 12.7× normal
- Short interest
- 0.8% of free float
Six moments. Six different trades.
- 1 · Candidate
Inside the buffer
Weeks to months before the cut-off. The name is near a band, a weight floor or a coverage line.
Edge: The distance, the move it needs, and honest odds of making it.
- 2 · Cut-off
Rank date passes
The provider's reference data is fixed. Rules-based indices are now near-decided.
Edge: Our ranking against the provider's, before any list is published.
- 3 · Announcement
Provider confirms
After the close. The forecast resolves. The scorecard updates the same night.
Edge: The report card and the size of the flow now due.
- 4 · Run-up
Announcement to implementation
Typically two to three weeks. Arbitrage desks and index funds position.
Edge: Flow in days of volume; crowding from short interest and options.
- 5 · Implementation close
The flow prints
The last session with the old composition. Volume runs 7 to 14 times normal on every index we have measured.
Edge: The one robust effect; closing-auction liquidity.
- 6 · After
Reversal window
Five to twenty sessions. Part of the run-up gives back, on average, with wide dispersion.
Edge: History by index and action, with the sample size.
What we sell, plainly. The price effect of an index change is small, skewed and has shrunk: over 86 FTSE 100 additions the median abnormal return on the implementation session was 0.0%.2 The volume effect is large and stable. So the product is knowledge of the forced trade: who, when, how much and how likely. It is not a promised return.
Six views of the same forced trade.
Radar: the trades not to miss
Every live row across 131 indices, ranked by expected forced volume: probability times days of the stock's own volume. A 40% call with eight days of volume outranks a 95% call with half a day. Re-sort by dollar flow or by probability.
| Stock | Index · action | P | Needs | Flow | Exp. days |
|---|---|---|---|---|---|
| ARM | US Tech 100 ADD | 0.88 | inside, 23% cushion | $1.9B | 3.7 |
| BBOX | FTSE 100 ADD | 0.31 | must rise 9.4% to 152p | £410M | 3.0 |
| WBD | S&P 500 DELETE · DEAL | 0.80 | completion of offer | $6.4B | 2.3 |
| SOBI | OMXS30 ADD | 0.94 | past rank date | SEK 2.1B | 2.3 |
| DOCS | S&P 400 → 500 MIGRATE | 0.46 | committee pick; 2 of 5 eligible | $3.1B | 2.1 |
| WIZZ | FTSE 250 DELETE | 0.71 | 4.1% from exit line | £95M | 1.9 |
Review pages with the band
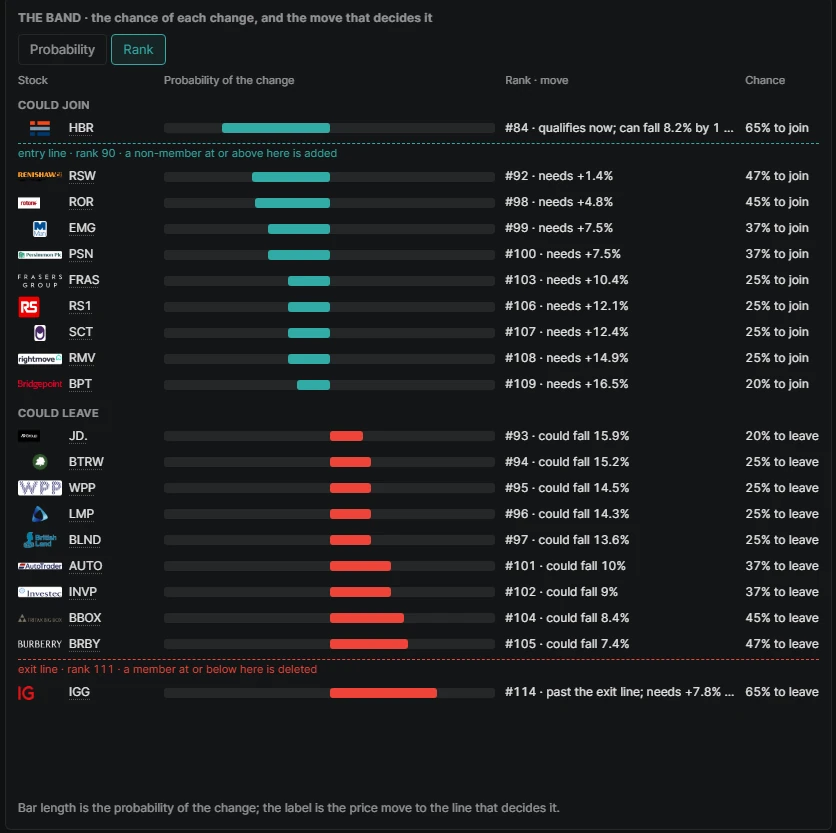
One review on one screen: the four dates and the countdown, the tracking assets and their source, and the band. Who is inside, who is on the line, and how far each name has to move. Shown here as it was in the app on 13 October 2026.
Trade pages: the move each name needs
The case in the unit you act on. The price move that decides the call, by when, at what odds; the forced flow in shares, currency and days of volume; and what the last such changes did.
- A 3.8% fall
- takes it to 25%
- +10.6%
- is even money
- Impl.-day volume, last 8
- 12.7× normal
- Short interest
- 0.8% of free float
Deals: the off-cycle half
Every pending takeover, spin-off or delisting that touches a covered index: the deletion it causes, the reserve-list replacement where the provider names one, and the tracker flow on both legs.
Alerts between reviews
Hear when a price crosses the line that decides a call, when a probability moves more than ten points, and when a review is announced.
The daily brief
Written every morning from the latest forecasts: what is inside 30 days, what changed overnight, the deals, and the latest scorecard. Every figure is read from the data.
Inside 30 days. Eleven reviews. The largest flow is the US Tech 100 annual review: ARM, APP and CRWD sit inside the top 100 with 15 to 23% cushion.
Changed since yesterday. Tritax Big Box moved up to a 31% FTSE 100 call after a 2.1% rise cut the distance to the entry line to 9.4%.
Scorecard. September reviews fully scored: FTSE 250 called 23 of 25 changes.
The band is a screenshot of a live review page on 13 October 2026. Rows in the other product views are example data, shown for illustration.
10,302 of 12,133 calls right the day before the announcement.1
85%, every scheduled review since 2018 across 46 indices, each forecast rebuilt point in time with only the data public on that date. Three weeks before the announcement, 82% were already right. Weak cells included.
- FTSE 100
- 86%
- addition calls right; deletions 85%
- US Tech 100
- 98%
- addition calls right; deletions 93%
- Russell 1000
- 88%
- addition calls right; deletions 87%
| Index | Since | Changes | Addition calls right | Deletion calls right | 3 weeks out: right |
|---|---|---|---|---|---|
| FTSE 100 | 2018 | 131 | 86% | 85% | 67% |
| STOXX Europe 600 | 2018 | 674 | 84% | 86% | 73% |
| US Tech 100 | 2018 | 91 | 98% | 93% | 96% |
| S&P 500 | 2023 | 72 | 64% | 81% | 64% |
| Russell 1000 | 2018 | 797 | 88% | 87% | 87% |
| Russell 2000 | 2018 | 4,362 | 88% | 95% | 91% |
| Nikkei 225 | 2018 | 57 | 96% | 86% | 91% |
| FTSE TWSE Taiwan 50 | 2018 | 100 | 94% | 94% | 82% |
| S&P/ASX 200 | 2018 | 250 | 67% | 84% | 74% |
| Nifty 50 | 2018 | 40 | 71% | 81% | 80% |
12.7× volume on the implementation close.2
The last 8 FTSE 100 additions, against 9.0× over 86 since 2010. Across every index we measure, implementation-day volume runs 7 to 14 times normal. Returns are smaller and less stable, so both samples are shown side by side: the two-year figure is recent behaviour, the long one is the base rate.
| FTSE 100 additions | Last 2 years | Since 2010 |
|---|---|---|
| Additions measured | 8 | 86 |
| Implementation-day volume, median | 12.7× | 9.0× |
| Abnormal return, implementation session | +1.4% | +0.0% |
| Moved the expected way | 75% | 50% |
| Next 5 sessions | −1.5% | +0.0% |
| Next 20 sessions | +3.7% | +1.9% |
3,601 APAC trades since 2018, losers included.3
| Family (APAC, since 2018) | Signal | Trades | Hit rate | Net to implementation close | t-stat (by review) |
|---|---|---|---|---|---|
| All six families pooled | Long adds + short deletes, 20 days out | 3,601 | 61% | +1.95% | 2.65 |
| S&P/ASX | Additions, 20 days | 558 | 53% | +2.79% | 1.60 |
| NIFTY family | Deletions, 20 days | 679 | 64% | +2.27% | 1.57 |
| FTSE TWSE Taiwan | Additions, 20 days | 180 | 65% | +4.30% | 1.47 |
| KOSPI 200 / KOSDAQ 150 | Deletions, 20 days | 318 | 67% | +2.03% | 1.30 |
| Nikkei 225 | Deletions, 20 days | 18 | 83% | −6.56% | −1.99 |
The forced trade, next to who is already positioned.
The forecast says what the trackers must do. The rest of ORTEX says how crowded the trade is and whether the stock can absorb it. Every join is on identifiers the platform already shares.
Short interest, utilisation, cost to borrow
An addition with high short interest meets forced buying with covering. A deletion with high short interest is already crowded, and the reversal after implementation is where it bites.
SI % of free float, 30-day change, cost to borrow and days to cover on every trade.
Options: open interest, IV, GEX, unusual activity
Implementation-day volume of 7 to 14 times normal is an IV event with a known date. The options data sells the trade; this add-on sells the date.
IV rank, open interest built in the review window, and the implementation date against the expiries.
ETF holdings and AUM
Tracking assets per index with the source and the date, and the funds that hold the stock today, so the flow figure is auditable.
Tracking AUM per index, ETF holders of the stock and what they hold.
Deals and corporate events
The deal behind every off-cycle change, its conditions and expected close, with the cited filing beside it.
Deal ladder rung, completion window and the reserve-list replacement.
See short interest and the options data.
131 indices in 22 markets, MSCI included.
MSCI global indices
MSCI World, World Small Cap, Emerging Markets and EM Small Cap and 61 MSCI country and regional indexes, forecast every day; scored over the MSCI reviews February 2024 to August 2026: 70% of MSCI World addition calls and 86% of deletion calls right the day before. Official MSCI, FTSE All-World and FTSE Global Small Cap changes processed before the next open.
Americas
S&P 500, S&P MidCap 400, S&P SmallCap 600, S&P Total Market, S&P Completion, US Tech 100, Russell 1000, Russell 2000, Russell 3000, CRSP US Mega Cap, CRSP US Large Cap, CRSP US Mid Cap, CRSP US Small Cap, the price-weighted US 30, S&P/TSX Composite and S&P/TSX 60.
UK and Europe
FTSE 100, FTSE 250, FTSE SmallCap, FTSE All-Share, STOXX Europe 50, EURO STOXX 50, STOXX Europe 600, EURO STOXX, DAX, MDAX, SDAX, TecDAX, CAC 40, CAC Next 20, CAC Large 60, CAC Mid 60, AEX, AMX, AScX, BEL 20, BEL Mid, BEL Small, FTSE MIB, FTSE Italia Mid Cap and ISEQ 20.
Nordics
OMX Stockholm 30, OMX Stockholm Benchmark, OMX Copenhagen 25, OMX Helsinki 25, OMX Iceland 10 and OBX.
Asia-Pacific
Nikkei 225, S&P/ASX 20, S&P/ASX 50, S&P/ASX 200, Hang Seng China Enterprises, Hang Seng TECH, FTSE TWSE Taiwan 50, FTSE TWSE Taiwan Mid-Cap 100, KOSPI 200 and KOSDAQ 150.
India and South Africa
Nifty 50, Nifty Next 50, Nifty 100, Nifty 200, Nifty 500, Nifty Midcap 150, FTSE/JSE Top 40, FTSE/JSE Small Cap and FTSE/JSE All Share.
131 indices. One add-on.
An add-on to ORTEX Advanced. Prices shown in USD, or your local currency where available.
Included with Advanced
Everyone on ORTEX Advanced, at no extra cost.
- Index calendar with countdowns
- Announced changes with flow and dates
- Track record and report cards
- Brief headline and the announced names
Index Rebalance add-on
Active traders, small funds and family offices. Requires Advanced.
- All forecasts for all 131 indices
- Radar, review pages, trade pages and deals
- Price sensitivity: the move each name needs
- What history says, on every row
- Alerts on price lines, probability and announcements
- Full daily brief and review previews
- CSV export of the current forecast
For desks
Event-driven and arbitrage desks that want the file.
- Everything in the add-on, up to 3 seats
- API with the extended columns
- Daily files and webhooks for alerts
- Point-in-time history from 2018 for backtesting
Bulk daily files, custom universes and redistribution are licensed through ORTEX for institutions. See the API docs.
Launch offer applies to monthly billing for new add-on subscribers, through the in-app upgrade. Taxes may apply.
Common questions.
What do I need to subscribe?
ORTEX Advanced and the Index Rebalance add-on. The add-on is $67 a month paid annually ($799 a year), or $99 month to month, shown in your local currency where available. At launch, monthly subscribers get 50% off their first 3 months. Manage or cancel it in the app at any time.
Can I trust the probabilities?
Yes, and you can check. When ORTEX says 30%, about three in ten such calls come true. We check this after every review and publish the result by probability band on the track record page, including the bands where our odds are off.
How is the track record scored?
Each forecast is taken point-in-time at the close the day before the provider's announcement, using only data public on that day. A call counts when its probability was 0.5 or more, and it is right when the named stock was added or deleted at that review.
Will an addition go up?
Not reliably, and we do not claim it will. Over 86 FTSE 100 additions since 2010 the median abnormal return on the implementation session was 0.0%. What is large and stable is the volume: 7 to 14 times normal on the implementation close. The add-on tells you who must trade, when, how much and how likely; what you do with it is your decision.
Which indices are covered?
131 indices in 22 markets, MSCI included, from the S&P 500, US Tech 100, Russell and CRSP to the FTSE, STOXX, DAX, CAC, AEX, BEL, FTSE MIB, ISEQ and Nordic indices, the Nikkei 225, S&P/ASX, Hang Seng, Taiwan 50, KOSPI 200, NIFTY and FTSE/JSE indices. Forecasts refresh every trading day before the open.
We need the data in our own systems. Which plan?
The desk plan, from $497 a month, adds the API with the extended columns, daily files, webhooks for alerts and point-in-time forecast history from 2018. Bulk delivery, custom universes and redistribution are licensed through data sales.
Seventy scheduled reviews a year. One is always inside 30 days.
Open the Radar every morning and see which forced trades are coming, how likely they are, and how big.